| business_id | business_name | inspection_date | inspection_score | risk_category | violation_description |
|---|---|---|---|---|---|
| 70182 | Target - Starbucks | 12/16/2016 12:00:00 AM | 96 | Low Risk | Inadequate warewashing facilities or equipment |
| 80037 | Starbucks Coffee #22607 | 10/26/2015 12:00:00 AM | 100 | No Risk | NA |
| 80044 | Starbucks Coffee #22432 | 08/03/2016 12:00:00 AM | 96 | Low Risk | Wiping cloths not clean or properly stored or inadequate sanitizer |
| 39495 | Macy’s West - Starbucks Coffee Company | 04/02/2015 12:00:00 AM | 98 | Low Risk | Unclean or degraded floors walls or ceilings |
| 39495 | Macy’s West - Starbucks Coffee Company | 04/08/2016 12:00:00 AM | 94 | Moderate Risk | Inadequately cleaned or sanitized food contact surfaces |
17 4.1 Exercises
The following dataset comes from the San Francisco Health Department via the San Francisco Open Data Portal at https://data.sfgov.org/d/pyih-qa8i
(License: PDDL 1.0 ODC Public Domain Dedication and Licence (PDDL))
This data records the results of several surprise health inspections conducted at restaurants in the SF area. Each inspection results in a health score between 0 and 100, a recording of the worst health violation recorded, and a classification of that violation as High, Moderate, or Low risk. (Some inspections result in no violations at all.)
In this study, we focus only on the inspections of Starbucks Coffee Shop location. A few rows of the dataset are shown below:
17.1 Exercises 4.1.1
Consider the following table, which shows the types of health and safety violations discovered at Starbucks locations in San Francisco:
| risk_category | n | percent |
|---|---|---|
| No Risk | 46 | 0.3622047 |
| Low Risk | 39 | 0.3070866 |
| Moderate Risk | 37 | 0.2913386 |
| High Risk | 5 | 0.0393701 |
- A restaurant is considered problematic if it has a more than 1/3 chance of a surprise inspection resulting in a Moderate or High Risk violation. We would like to know if Starbucks is a problematic franchise in SF.
Express the research question in the context of a generative model.
How often would your model from (a) generate the observed data for Starbucks, or more extreme?
What do you conclude? Is Starbucks in SF problematic?
- A restaurant is considered fully safe if it has at least a 1/2 chance of a surprise inspection resulting in a no violations.
Express the research question in the context of a generative model.
How often would your model from (a) generate the observed data for Starbucks, or more extreme?
What do you conclude? Is Starbucks in SF a fully safe franchise?
17.2 Exercises 4.1.2
Here is a plot of the observed scores from all the inspections of SF Starbucks locations:
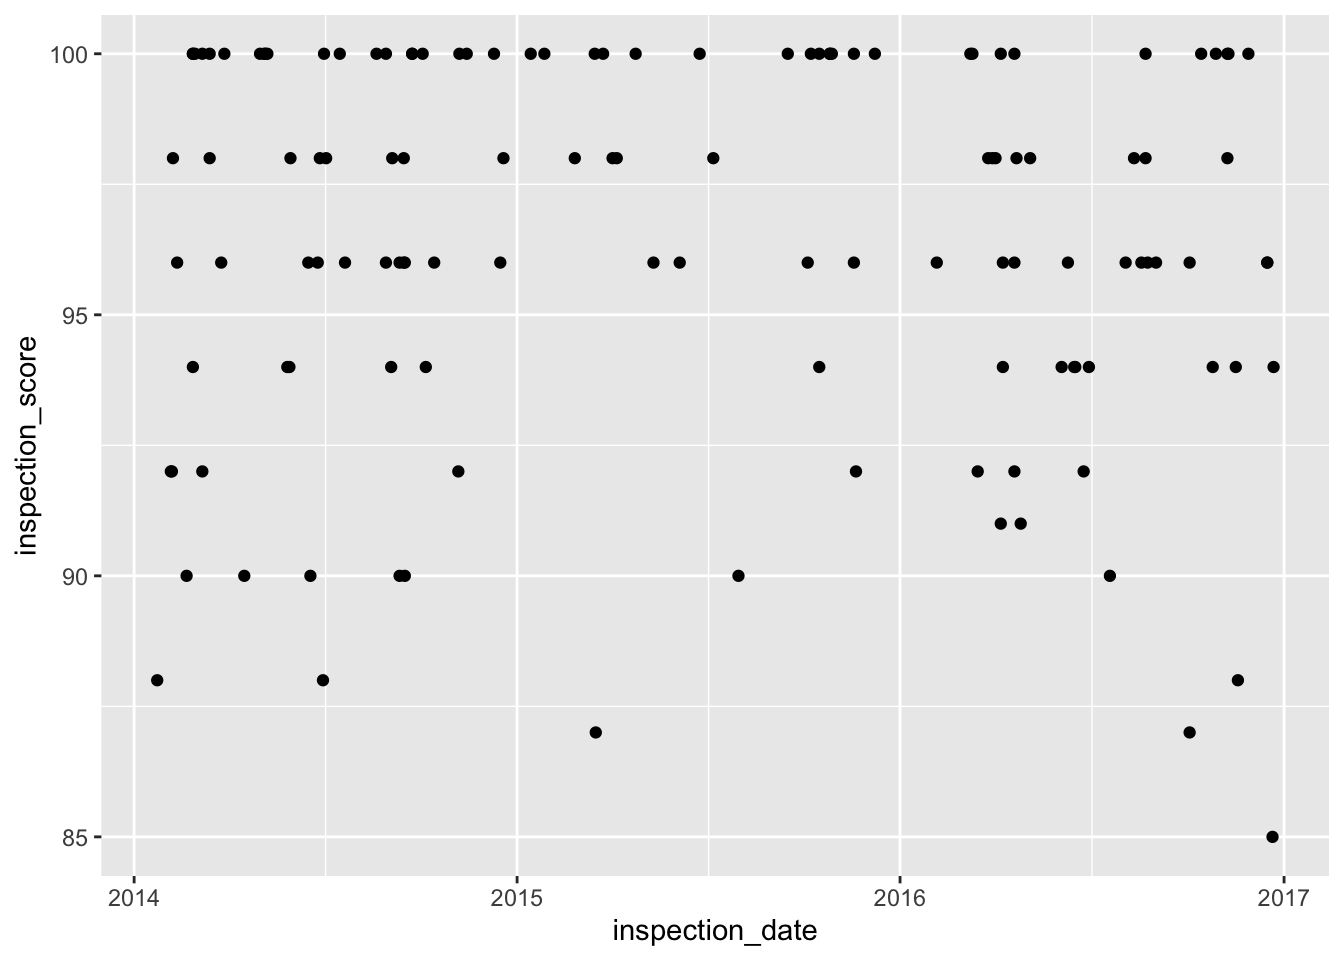
Consider three proposed truths:
- The true mean health score of Starbucks in SF is 90 points.
- The true mean health score of Starbucks in SF is 95 points.
- The true mean health score of Starbucks in SF is 97 points.
- For each of these possible truths…
State the claim in the form of a statistical model.
Estimate the average residual for the model. That is, about how far are the points on average from a horizontal line drawn at the proposed mean value?
Interpret your results. Which of the proposed models seem reasonable? Which do not?
17.3 Exercises 4.1.3
You calculate the sample mean inspection score to be 96.4. The sum of squared error (i.e., the variance) is calculated to be 15.5. You decide to test Model 2, which proposes that the true mean is 95. You get an R^2 value of 0.13, and F-Stat of 18.67, and a p-value of nearly 0.
a. Interpret the R^2 value. What does it tell you?
b. What was the sum of squared error for the null hypothesis?
c. What do you conclude from the ANOVA F-Test?
17.4 Exercises 4.1.4
Consider the following summary statistics for the inspection scores of SF Starbucks locations:
| mean(inspection_score) | sd(inspection_score) |
|---|---|
| 96.40157 | 3.699549 |
- A restaurant is given an “A” grade for safety if their score is over 90 points. We would like to know if there is evidence that Starbucks is truly an “A” level restaurant.
State the null and alternate model for an ANOVA test.
An ANOVA test results in an R-Squared of 0.75. Interpret this number - what does it measure?
The F-stat is found to be 381. The p-value for the F-stat of 381 is 0. What do you conclude?
Perform a hypothesis test using z-scores and Bell Curve approach, to address the same research question. How does your answer compare to the results of the ANOVA test? Why does this make sense?
- Consider comparing the risk scores from all the Starbucks locations in this dataset.
State the null and alternate model for an ANOVA test.
An ANOVA test results in an R-Squared of 0.22. Interpret this number - what does it measure?
The F-stat is found to be 1.73. The p-value for this F-stat is 0.045. What do you conclude?
Does this mean that every Starbucks has significantly different scores from every other Starbucks?