total_bill | tip | percent_tip | smoker | day | time | size |
|---|---|---|---|---|---|---|
17.59 | 2.64 | 0.1500853 | No | Sat | Dinner | 3 |
25.21 | 4.29 | 0.1701706 | Yes | Sat | Dinner | 2 |
31.27 | 5.00 | 0.1598977 | No | Sat | Dinner | 3 |
20.08 | 3.15 | 0.1568725 | No | Sat | Dinner | 3 |
16.00 | 2.00 | 0.1250000 | Yes | Thur | Lunch | 2 |
13 3.2 Exercises
The following questions refer to the dataset from Chapter 2.4, in which a waiter collected information about bills and tips at his tables for a week. A few rows of the dataset are shown below:
Some summary statistics for this dataset are given below:
smoker | total_bill_mean | total_bill_sd | total_bill_n |
|---|---|---|---|
No | 19.01 | 8.34 | 31 |
Yes | 20.29 | 9.87 | 26 |
day | percent_tip_mean | percent_tip_sd | percent_tip_n |
|---|---|---|---|
Fri | 0.15 | 0.03 | 6 |
Sat | 0.17 | 0.06 | 23 |
Sun | 0.20 | 0.09 | 13 |
Thur | 0.17 | 0.04 | 15 |
time | smoker | n |
|---|---|---|
Dinner | No | 22 |
Dinner | Yes | 17 |
Lunch | No | 9 |
Lunch | Yes | 9 |
Correlations:
variable | total_bill | tip | percent_tip | size |
|---|---|---|---|---|
total_bill | 1.0000000 | 0.5706443 | -0.4267555 | 0.6181611 |
tip | 0.5706443 | 1.0000000 | 0.4040693 | 0.4565800 |
percent_tip | -0.4267555 | 0.4040693 | 1.0000000 | -0.2095724 |
size | 0.6181611 | 0.4565800 | -0.2095724 | 1.0000000 |
13.1 Exercises 3.2.1
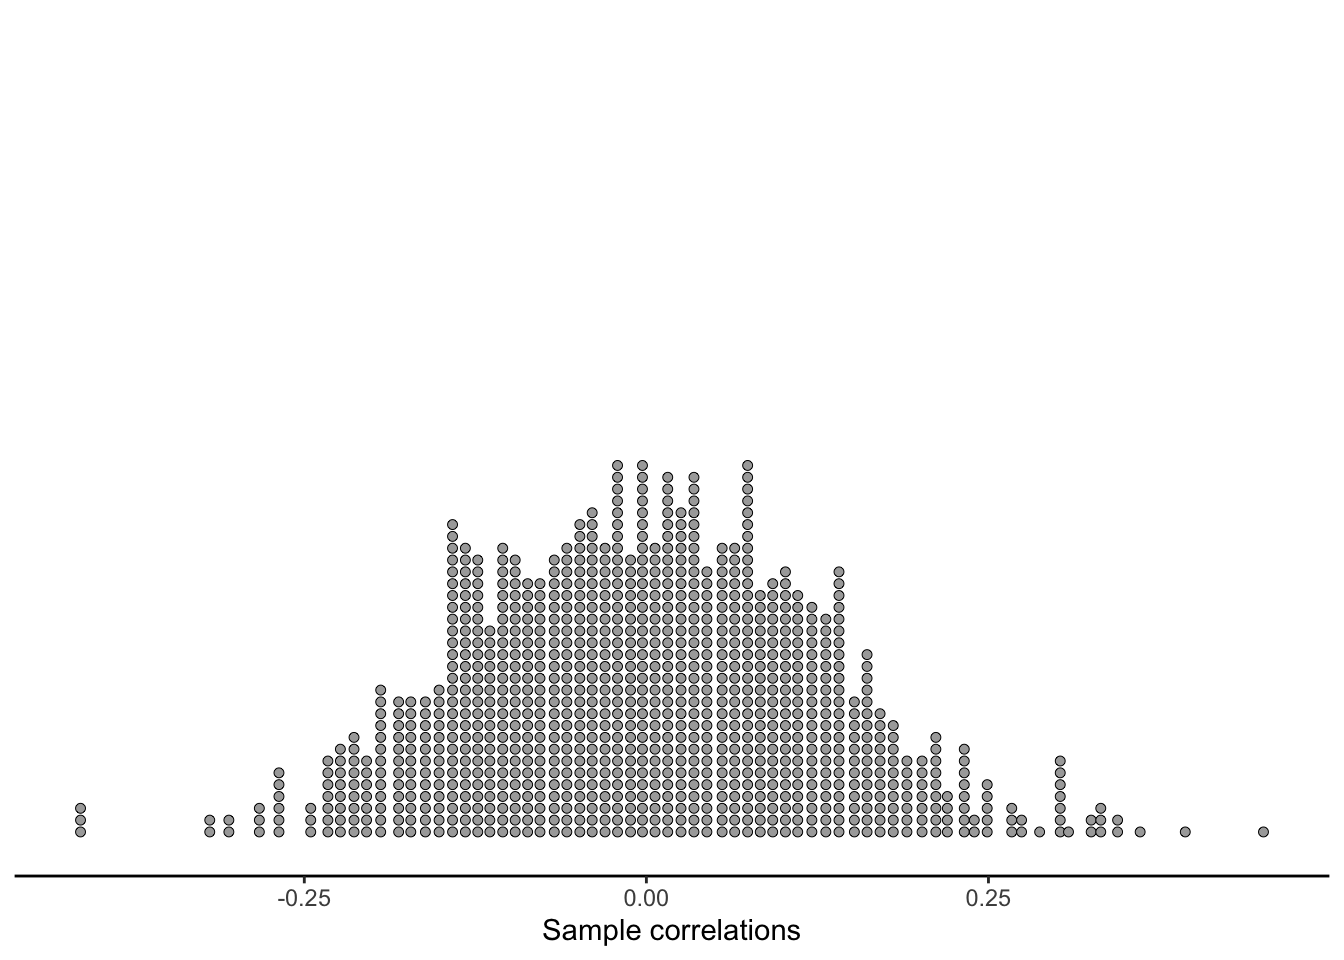
- Consider the research question,
Do dining parties with more people tend to tip higher percentages?
The following histogram shows the results of simulating data 1000 times from the null distribution.
State the alternate hypothesis in words.
State the alternate hypothesis in symbols.
In our real data, we observed a sample correlation between
percent_tipandsizeof -0.21.
What is the approximate p-value of our study?
- What do you conclude?
- Consider the research question,
Do smokers have different spending habits than non-smokers?
The following histogram shows the results of simulating data 1000 times from the null distribution.
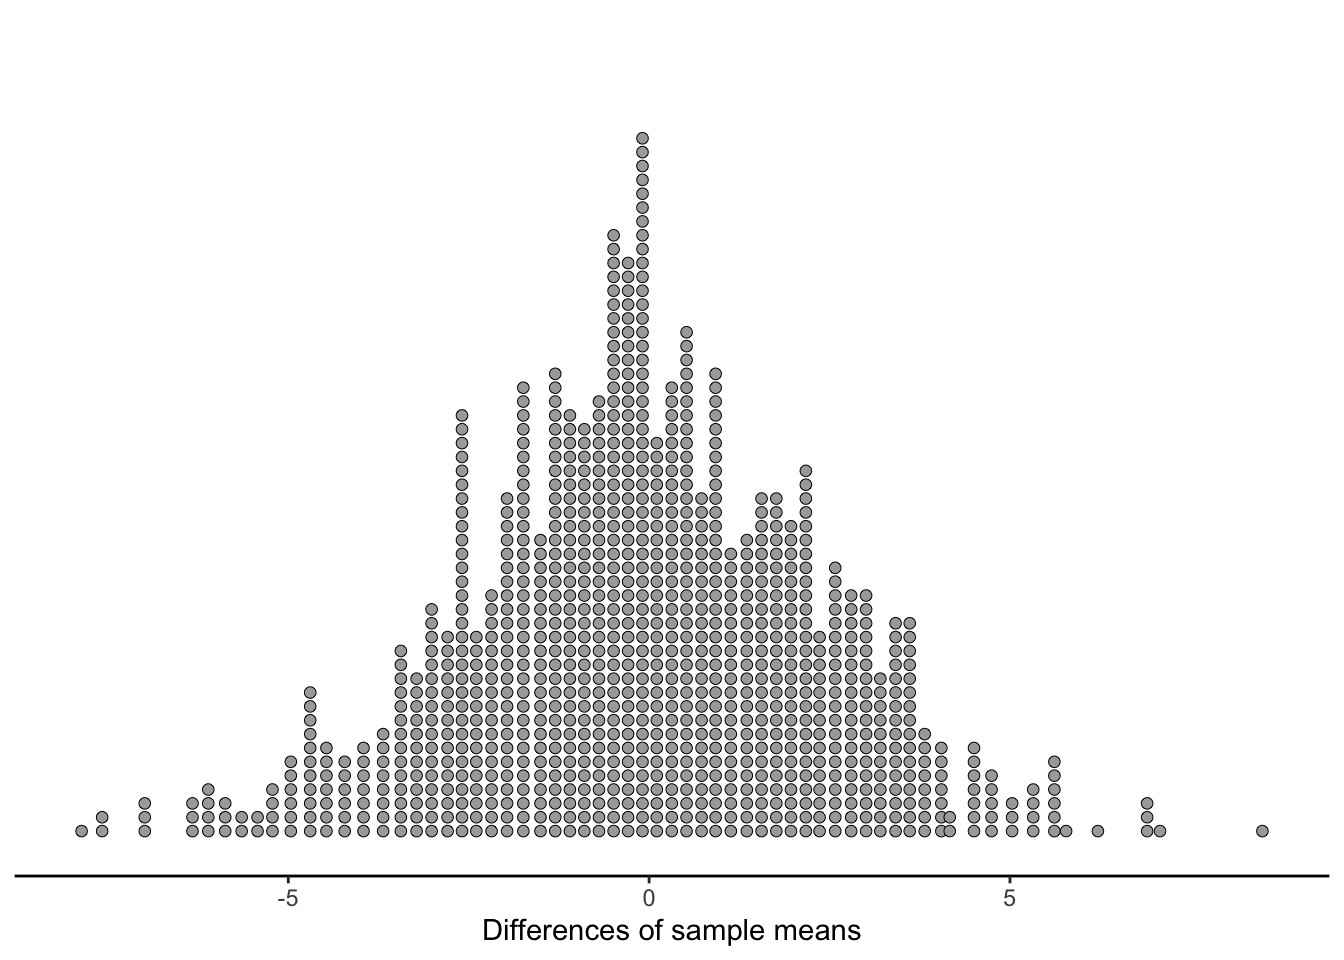
State the alternate hypothesis in words.
State the alternate hypothesis in symbols.
What is the approximate p-value of our study?
What do you conclude?
- Consider the research question,
Are there more smokers or non-smokers?
The following histogram shows the results of simulating data 1000 times from the null distribution.
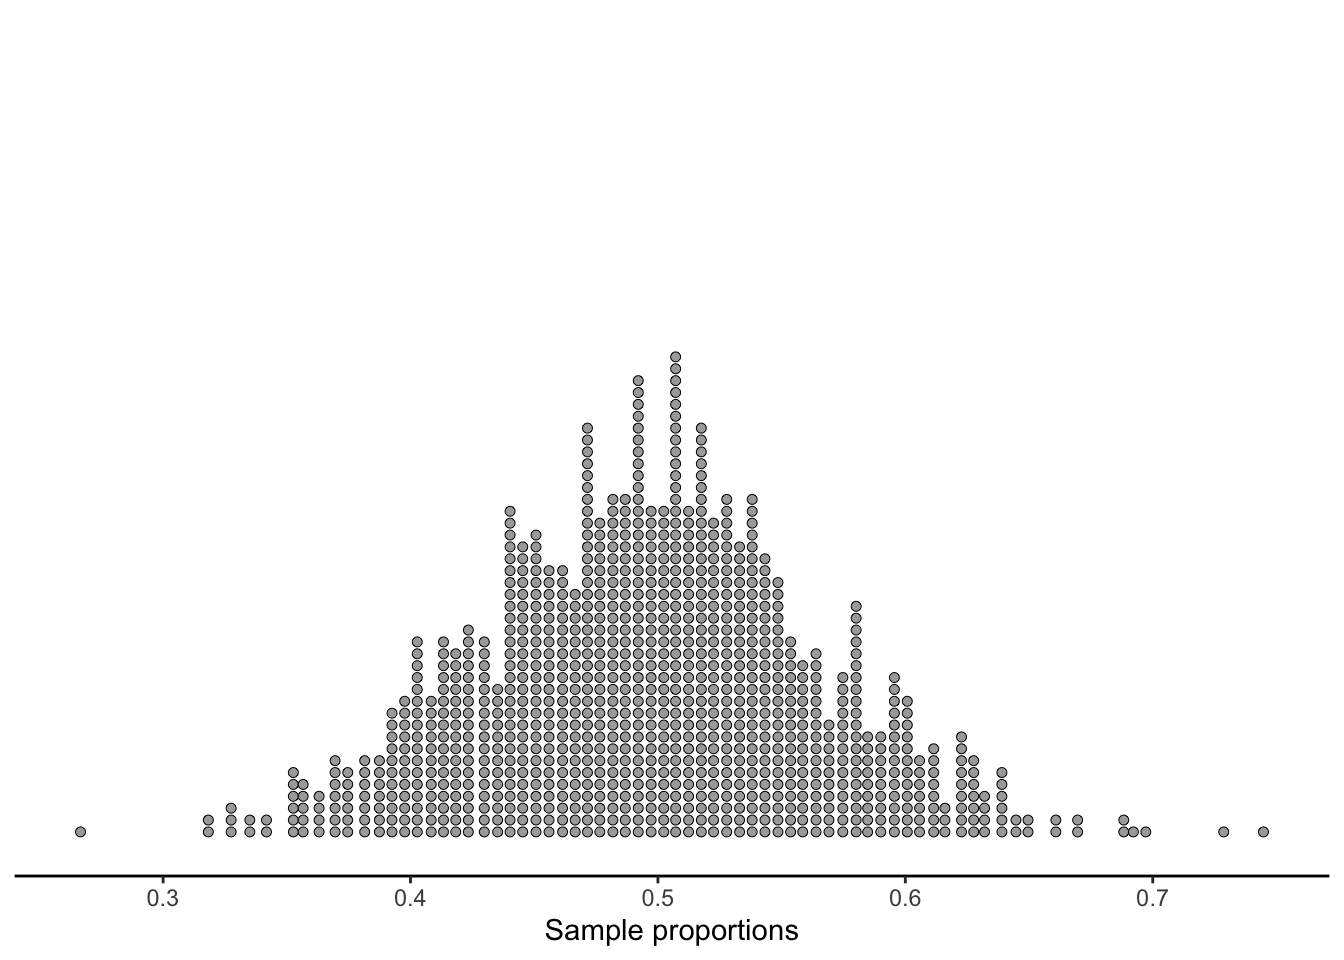
State the alternate hypothesis in words.
State the alternate hypothesis in symbols.
What is the approximate p-value of our study?
What do you conclude?
13.2 Exercises 3.2.2
Choose one of the research questions we addressed in Exercises 3.2.1. Report a full formal hypothesis test, including all steps from the readings.
13.3 Exercises 3.2.3
For all three research questions from Exercises 3.2.1, state whether we:
- Definitely committed Type I Error
- Definitely committed Type II Error
- May have committed Type I Error
- May have committed Type II Error
- Definitely did not commit Type I Error
- Definitely did not commit Type II Error