| year | month | day | dep_time | sched_dep_time | dep_delay | arr_time | sched_arr_time | arr_delay | carrier | flight | tailnum | origin | dest | air_time | distance | hour | minute | time_hour |
|---|---|---|---|---|---|---|---|---|---|---|---|---|---|---|---|---|---|---|
| 2013 | 2 | 22 | 1319 | 1302 | 17 | 1422 | 1404 | 18 | EV | 4129 | N13958 | EWR | DCA | 45 | 199 | 13 | 2 | 2013-02-22 13:00:00 |
| 2013 | 3 | 17 | 1825 | 1830 | -5 | 2015 | 2015 | 0 | MQ | 4674 | N503MQ | LGA | CLE | 83 | 419 | 18 | 30 | 2013-03-17 18:00:00 |
| 2013 | 5 | 27 | 2125 | 2124 | 1 | 2353 | 21 | -28 | UA | 1692 | N27239 | EWR | MCO | 124 | 937 | 21 | 24 | 2013-05-27 21:00:00 |
| 2013 | 8 | 5 | 1713 | 1712 | 1 | 1854 | 1844 | 10 | B6 | 408 | N190JB | JFK | PWM | 49 | 273 | 17 | 12 | 2013-08-05 17:00:00 |
| 2013 | 9 | 17 | 1713 | 1713 | 0 | 1852 | 1856 | -4 | EV | 4202 | N22909 | EWR | STL | 132 | 872 | 17 | 13 | 2013-09-17 17:00:00 |
| 2013 | 9 | 21 | 1441 | 1450 | -9 | 1540 | 1602 | -22 | EV | 4372 | N13118 | EWR | DCA | 38 | 199 | 14 | 50 | 2013-09-21 14:00:00 |
| 2013 | 10 | 22 | 1232 | 1232 | 0 | 1538 | 1530 | 8 | B6 | 1401 | N583JB | JFK | FLL | 160 | 1069 | 12 | 32 | 2013-10-22 12:00:00 |
| 2013 | 11 | 11 | 1503 | 1505 | -2 | 1843 | 1830 | 13 | AA | 145 | N5FRAA | JFK | MIA | 154 | 1089 | 15 | 5 | 2013-11-11 15:00:00 |
| 2013 | 11 | 29 | 1410 | 1415 | -5 | 1616 | 1636 | -20 | DL | 673 | N939DL | EWR | ATL | 107 | 746 | 14 | 15 | 2013-11-29 14:00:00 |
| 2013 | 12 | 22 | 2018 | 1901 | 77 | 2342 | 2251 | 51 | UA | 1489 | N24202 | EWR | SFO | 351 | 2565 | 19 | 1 | 2013-12-22 19:00:00 |
1.1 Exercises
Exercise 1.1.1
The following dataset consists of sales at a certain company in Indiana, with locations in five different states, over the course of a few months.
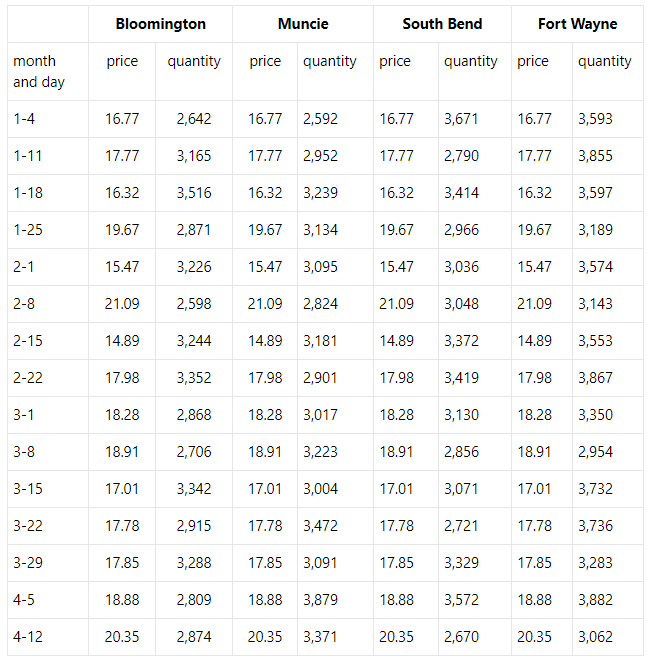
Name two ways that this data is not tidy, and how you would fix that problem.
Exercise 1.1.2
The following data contains information about flights leaving NYC airports (JFK, LGA or EWR) in 2013.
(Source: nycflights13 R package)
First, consider the first few rows of the flights dataset:
Important: These are just a few rows, the full dataset contains thousands of rows of data!
Click here for descriptions of the variables in the dataset. Note that:
The tail number of a plane is a unique number identifying that specific physical airplane, much like a person’s name.
The flight number of a flight is a label that an airline gives to a particular route. For example, “United Flight 52” goes from Washington, DC to Zurich, Switzerland; while “American Airlines Flight 52” goes from Indianapolis to Chicago.
What are the cases for this dataset?
The routes served by airlines from NYC airports
The departure and arrival times of the flights
The dates on which at least one flight left an NYC airport
The flights that left NYC airports in 2013
Choose one or more columns below that, together, would uniquely identify each case.
year
month
day
hour
minute
dep_time
arr_time
carrier
flight
tailnum
origin
dest
Next, consider the planes dataset. This contains information about the airplanes that were used in flights from New York in 2013. The first few rows are shown below:
| tailnum | year | type | manufacturer | model | engines | seats | speed | engine |
|---|---|---|---|---|---|---|---|---|
| N344AA | 1992 | Fixed wing | GULFSTREAM AEROSPACE | G-IV | 2 | 22 | NA | Turbo-fan |
| N351NW | 1997 | Fixed wing | AIRBUS INDUSTRIE | A320-212 | 2 | 182 | NA | Turbo-fan |
| N12563 | 2002 | Fixed wing | EMBRAER | EMB-145LR | 2 | 55 | NA | Turbo-fan |
| N568UW | 2013 | Fixed wing | AIRBUS | A321-231 | 2 | 379 | NA | Turbo-fan |
| N834MH | 2000 | Fixed wing | BOEING | 767-432ER | 2 | 300 | NA | Turbo-jet |
| N8977A | 2004 | Fixed wing | BOMBARDIER INC | CL-600-2B19 | 2 | 55 | NA | Turbo-fan |
What are the cases for this dataset?
The years that planes were built
The planes that flew from NYC
The companies that make planes
The types of planes that fly from NYC
Which of the following column(s) are needed to uniquely identify each case? (check all that apply, but do not check more than the minimum needed to identify the case)
tailnum
year
type
manufacturer
model
Last, consider a dataset about the weather at the airports that flights from NYC leave from. The first few rows are shown below:
| origin | year | month | day | hour | temp | dewp | humid | wind_dir | wind_speed | wind_gust | precip | pressure | visib | time_hour |
|---|---|---|---|---|---|---|---|---|---|---|---|---|---|---|
| EWR | 2013 | 1 | 1 | 1 | 39.02 | 26.06 | 59.37 | 270 | 10.35702 | NA | 0 | 1012.0 | 10 | 2013-01-01 01:00:00 |
| EWR | 2013 | 1 | 1 | 2 | 39.02 | 26.96 | 61.63 | 250 | 8.05546 | NA | 0 | 1012.3 | 10 | 2013-01-01 02:00:00 |
| EWR | 2013 | 1 | 1 | 3 | 39.02 | 28.04 | 64.43 | 240 | 11.50780 | NA | 0 | 1012.5 | 10 | 2013-01-01 03:00:00 |
| JFK | 2013 | 1 | 1 | 1 | 39.02 | 26.06 | 59.37 | 260 | 12.65858 | NA | 0 | 1012.6 | 10 | 2013-01-01 01:00:00 |
| JFK | 2013 | 1 | 1 | 2 | 39.02 | 26.06 | 59.37 | 270 | 11.50780 | NA | 0 | 1012.4 | 10 | 2013-01-01 02:00:00 |
| JFK | 2013 | 1 | 1 | 3 | 39.92 | 26.96 | 59.50 | 260 | 14.96014 | NA | 0 | 1012.7 | 10 | 2013-01-01 03:00:00 |
| LGA | 2013 | 1 | 1 | 1 | 39.92 | 26.06 | 57.33 | 260 | 13.80936 | 23.01560 | 0 | 1011.9 | 10 | 2013-01-01 01:00:00 |
| LGA | 2013 | 1 | 1 | 2 | 41.00 | 26.06 | 54.97 | 260 | 17.26170 | 25.31716 | 0 | 1011.5 | 10 | 2013-01-01 02:00:00 |
| LGA | 2013 | 1 | 1 | 3 | 41.00 | 26.06 | 54.97 | 260 | 16.11092 | 24.16638 | 0 | 1012.0 | 10 | 2013-01-01 03:00:00 |
- What are the cases for this dataset?
Days on which the weather was measured
Days on which the weather was measured at a particular airport
Hours when the weather was measured
Hours when the weather was measured at a particular airport
- Which of the following column(s) are needed to uniquely identify each case? (check all that apply, but do not check more than the minimum needed to identify the case)
origin
year
month
day
hour
temp
Exercise 1.1.3
India is the world’s third-largest producer and third-largest consumer of electricity. The national electric grid in India has an installed capacity of 370.106 GW as of 31 March 2020.
The data in these exercises was collected to study the energy consumption in four of of India’s largest states - Punjab, Delhi, Gujarat, and Goa - over the time period of Jan 2, 2019 to May 23, 2020.
| Date | Punjab | Delhi | Gujarat | Goa |
|---|---|---|---|---|
| 02/01/2019 00:00:00 | 119.9 | 85.8 | 319.5 | 12.8 |
| 03/01/2019 00:00:00 | 121.9 | 85.5 | 316.7 | 13.7 |
| 04/01/2019 00:00:00 | 118.8 | 83.5 | 301.9 | 12.6 |
| 05/01/2019 00:00:00 | 121.0 | 79.2 | 313.2 | 13.0 |
| 06/01/2019 00:00:00 | 121.4 | 76.6 | 320.7 | 12.9 |
| 07/01/2019 00:00:00 | 118.0 | 71.1 | 319.4 | 12.7 |
This dataset is currently in… (circle all that apply)
Long form
Wide form
Un-tidy format
Tidy format
What are the cases in this dataset?
States that were studied
Energy consumption of states
Days on which energy consumption was measured
Total energy consumed on each date
If we were to convert this dataset from it’s current (long/wide) form to the other form, what would possibly be the new column names?
“State”, “Day”, “Month”, “Year”
“Date”, “State”, “Consumption”
“Date”, “Punjab Consumption”, “Delhi Consumption”, “Gujarat Consumption”, “Goa Consumption”
“State”, “Consumption on 02/01/2019”, “Consumption on 02/02/2019”, …, “Consumption on 03/23/2020”
What would be the cases in this new dataset?
States that were studied
Energy consumption of states on each date
Days on which energy consumption was measured for a particular state
Total energy consumed over time by each state
Exercise 1.1.4
Let’s revisit the flights dataset from Exercise 1.1.2
| year | month | day | dep_time | sched_dep_time | dep_delay | arr_time | sched_arr_time | arr_delay | carrier | flight | tailnum | origin | dest | air_time | distance | hour | minute | time_hour |
|---|---|---|---|---|---|---|---|---|---|---|---|---|---|---|---|---|---|---|
| 2013 | 1 | 1 | 517 | 515 | 2 | 830 | 819 | 11 | UA | 1545 | N14228 | EWR | IAH | 227 | 1400 | 5 | 15 | 2013-01-01 05:00:00 |
| 2013 | 1 | 1 | 533 | 529 | 4 | 850 | 830 | 20 | UA | 1714 | N24211 | LGA | IAH | 227 | 1416 | 5 | 29 | 2013-01-01 05:00:00 |
| 2013 | 1 | 1 | 542 | 540 | 2 | 923 | 850 | 33 | AA | 1141 | N619AA | JFK | MIA | 160 | 1089 | 5 | 40 | 2013-01-01 05:00:00 |
| 2013 | 1 | 1 | 544 | 545 | -1 | 1004 | 1022 | -18 | B6 | 725 | N804JB | JFK | BQN | 183 | 1576 | 5 | 45 | 2013-01-01 05:00:00 |
| 2013 | 1 | 1 | 554 | 600 | -6 | 812 | 837 | -25 | DL | 461 | N668DN | LGA | ATL | 116 | 762 | 6 | 0 | 2013-01-01 06:00:00 |
| 2013 | 1 | 1 | 554 | 558 | -4 | 740 | 728 | 12 | UA | 1696 | N39463 | EWR | ORD | 150 | 719 | 5 | 58 | 2013-01-01 05:00:00 |
- Name all variables from this dataset that might be considered quantitative.
- Name all variables from this dataset that might be considered categorical.
- Name all variables from this dataset that might be considered other.
- What are the levels of the variable
origin?
Exercise 1.1.5
Let’s revisit the planes dataset from Exercise 1.1.2
| tailnum | year | type | manufacturer | model | engines | seats | speed | engine |
|---|---|---|---|---|---|---|---|---|
| N10156 | 2004 | Fixed wing | EMBRAER | EMB-145XR | 2 | 55 | NA | Turbo-fan |
| N102UW | 1998 | Fixed wing | AIRBUS INDUSTRIE | A320-214 | 2 | 182 | NA | Turbo-fan |
| N103US | 1999 | Fixed wing | AIRBUS INDUSTRIE | A320-214 | 2 | 182 | NA | Turbo-fan |
| N104UW | 1999 | Fixed wing | AIRBUS INDUSTRIE | A320-214 | 2 | 182 | NA | Turbo-fan |
| N10575 | 2002 | Fixed wing | EMBRAER | EMB-145LR | 2 | 55 | NA | Turbo-fan |
| N105UW | 1999 | Fixed wing | AIRBUS INDUSTRIE | A320-214 | 2 | 182 | NA | Turbo-fan |
Below, we can see the possible values for some of the variables in this dataset:
# A tibble: 6 × 1
  engine
  <chr>
1 Turbo-fan
2 Turbo-jet
3 Reciprocating
4 4 Cycle
5 Turbo-shaft
6 Turbo-prop
# A tibble: 2 × 1
type
<chr>
1 Fixed wing
2 Rotorcraft# A tibble: 4 × 1
engines
<int>
1 2
2 1
3 4
4 3- Name all variables in this dataset that could be considered discrete.
- Name all variables in this dataset that could be considered ordinal.
- Name all variables in this dataset that could be considered binary.
Now, let’s consider altering the flights dataset from Exercise 1.1.2
| year | month | day | dep_time | sched_dep_time | dep_delay | arr_time | sched_arr_time | arr_delay | carrier | flight | tailnum | origin | dest | air_time | distance | hour | minute | time_hour |
|---|---|---|---|---|---|---|---|---|---|---|---|---|---|---|---|---|---|---|
| 2013 | 2 | 22 | 1319 | 1302 | 17 | 1422 | 1404 | 18 | EV | 4129 | N13958 | EWR | DCA | 45 | 199 | 13 | 2 | 2013-02-22 13:00:00 |
| 2013 | 3 | 17 | 1825 | 1830 | -5 | 2015 | 2015 | 0 | MQ | 4674 | N503MQ | LGA | CLE | 83 | 419 | 18 | 30 | 2013-03-17 18:00:00 |
| 2013 | 5 | 27 | 2125 | 2124 | 1 | 2353 | 21 | -28 | UA | 1692 | N27239 | EWR | MCO | 124 | 937 | 21 | 24 | 2013-05-27 21:00:00 |
| 2013 | 8 | 5 | 1713 | 1712 | 1 | 1854 | 1844 | 10 | B6 | 408 | N190JB | JFK | PWM | 49 | 273 | 17 | 12 | 2013-08-05 17:00:00 |
| 2013 | 9 | 17 | 1713 | 1713 | 0 | 1852 | 1856 | -4 | EV | 4202 | N22909 | EWR | STL | 132 | 872 | 17 | 13 | 2013-09-17 17:00:00 |
| 2013 | 9 | 21 | 1441 | 1450 | -9 | 1540 | 1602 | -22 | EV | 4372 | N13118 | EWR | DCA | 38 | 199 | 14 | 50 | 2013-09-21 14:00:00 |
| 2013 | 10 | 22 | 1232 | 1232 | 0 | 1538 | 1530 | 8 | B6 | 1401 | N583JB | JFK | FLL | 160 | 1069 | 12 | 32 | 2013-10-22 12:00:00 |
| 2013 | 11 | 11 | 1503 | 1505 | -2 | 1843 | 1830 | 13 | AA | 145 | N5FRAA | JFK | MIA | 154 | 1089 | 15 | 5 | 2013-11-11 15:00:00 |
| 2013 | 11 | 29 | 1410 | 1415 | -5 | 1616 | 1636 | -20 | DL | 673 | N939DL | EWR | ATL | 107 | 746 | 14 | 15 | 2013-11-29 14:00:00 |
| 2013 | 12 | 22 | 2018 | 1901 | 77 | 2342 | 2251 | 51 | UA | 1489 | N24202 | EWR | SFO | 351 | 2565 | 19 | 1 | 2013-12-22 19:00:00 |
- Suppose I wanted to make a new variable called
late, that shows whether the flight arrived late or not. What quantitative variable would we need to bin to create this new variable? What would those bins be? - Suppose I wanted to convert the
origincolumn to dummy variables. What would be the new column names in the dataset after this process, and what possible values could they have? - Suppose I wanted to make a new variable called
flight_type, with possible values “International” or “Domestic”. What categorical variable would I use to combine categories and make this new variable? Explain.