platelet_count | percent |
|---|---|
HIGH | 0.6% |
LOW | 32.6% |
NORMAL | 31.4% |
RARE | 10.5% |
VERY LOW | 25.0% |
Case Study: Hospital Medical Records
Click here to access the data for this case study in Google Sheets.
For this Case Study, you do not need to make any edits or do any analyses on the datasets. However, you may need to click and scroll around in the spreadsheets to fully understand the data and answer the questions.
The datasets in this Case Study are taken from the MIMIC Project, a free and open dataset of anonymized hospital and medical data. (mimic1?; mimic2?; physnet?)
There are four datasets provided to you. The first, Hospital Admissions contains information on admissions of individuals to a particular hospital. This dataset includes the admit and discharge times, with a death time if applicable; the type of admission and location of discharge; demographic and insurance information about the patient; and diagnoses.
The other three datasets are results of lab tests run on blood samples during the patients’ stay at the hospital.
The Platelet Counts dataset references a test that looks under a microscope to count the number of megakaryocytes, or “platelets” present in bone marrow. It is good to have a high platelet count, as this helps your body heal injuries and stop bleeding.
The Blood Oxygen dataset references to a test where the oxygen and carbon dioxide present in the blood are measured. It is good to have 100% oxygen (and thus 0% carbon dioxide), as this means your lungs are working efficiently.
The Cholesterol dataset references to a test that measures cholesterol, a “waxy” substance present in blood. High cholesterol can increase risk of heart disease due to clogged arteries, but low cholesterol can prevent your body from building new healthy cells. There are two types of cholesterol: low-density lipoprotein (LDL), which is associated with heart disease risk and is considered bad to have; and high-density lipoprotein (HDL), which helps get rid of LDL and is considered good to have.
The following Case Study will ask you to think about the information in these datasets and how it was recorded.
Part One: Describe the datasets
Data Tables
Hospital admissions
There are 16 variables and 121 observations in this dataset. Each row/case represents an instance of a person being admitted to the hospital. The cases can be indexed with the hadm_id column, or by combining the subject_id and admittime columns.
(Note: subject_id alone is NOT sufficient, since a person could be admitted and/or tested multiple times.)
Platelet counts
There are 4 variables and 172 observations in this dataset. Each row/case represents a moment that a patient’s platelet counts were measured. The cases can be indexed by combining the subject_id and charttime columns.
(Note: It is not correct to say that the cases are platelet counts of patients. This is what we are studying, but a case is what each row represents. Here, that is an instance when a platelet count test was run.)
Blood Oxygen levels
There are 5 variables and 343 observations in this dataset. Each row/case represents a moment that a patient’s blood oxygen level was measured. The cases can be indexed by combining the subject_id and charttime columns.
Cholesterol
There are 7 variables and 24 observations in this dataset. Each row/case represents a moment that a patient’s cholesterol levels were measured. The cases can be indexed by combining the subject_id and charttime columns.
Variable Types
A binary categorical variable
hospital_expire: Only 1 (if patient died) or 0 (if patient survived)hospital_survive: Only 1 (if patient survived) or 0 (if patient died)From the cholesterol dataset,
flag: “abnormal” if outside normal range, NA if not.
An ordinal categorical variable
platelet_count: Categories are ordered “Rare”, “Very Low”, “Low”, “Normal”, “High”.hadm_id: Not the best answer, but acceptable, if we think the ID numbers are in order.
A categorical variable that is neither binary nor ordinal
From the hospital admissions dataset:
admission_type,discharge_location,insurance,religion,marital_status,ethnicity,diagnosisAcceptable, but not the best answer, because they aren’t really categories:
subject_idorhadm_id
A quantitative variable
Acceptable, but really categorical:
hospital_expireandhospital_surviveoxygen_pct_valueLDL_valueHDL_value
A dummy variable
hospital_expire: Only 1 (if patient died) or 0 (if patient survived)hospital_survive: Only 1 (if patient survived) or 0 (if patient died)
A categorical variable that was created by binning a continuous quantitative variable.
flagwas categorized as “abnormal” or not based on the measured cholesterol levels
A categorical variable that was probably created by binning a discrete quantitative variable.
platelet_countwas put into categories according to some number of platelets
A variable that is a date type.
From hospital admissions dataset:
admittime,dischtime,deathtimeFrom the other three datasets:
charttime
A variable that is not a label or index; not a date; not quantitative; and not categorical.
Blood oxygen
valueuom: Tells us that the units of measurement for the blood oxygen data are percentsCholesterol
valueuom: Tells us that the units of measurement for the cholesterol levels data are milligrams per decileter (mg/dL).
Missing Data
A variable where blank cells should be treated as
NA(“Not Available”) because we have no way to know why it is blank.From hospital admissions data,
subject_id,hadm_id,admittime,dischtime,admission_type,discharge_location,insurance,religion,marital_status,ethnicity,diagnosis,hospital_expire,hospital_surviveFrom others:
subject_id,charttime,platelet_count,oxygen_pct_value,LDL_value,HDL_value
A variable where blank cells should be treated as
NA(“Not Applicable”) because there is genuinely no possible value for the variable in that case.deathtime: No applicable value if the person did not dieIn the platelet, blood oxygen, or cholesterol datasets:
hadm_id, it’s possible this subject was not admitted to the emergency room before being tested.
A variable where blank cells are meaningful and should be treated as a real value/category.
diagnosis: Perhaps the patient was not diagnosed with anythingflag: The NAs represent normal, not abnormal, cholesterol levels.
A variable where missing information is coded as “unknown” or similar.
ethnicityhas an option ofUNKNOWN/NOT SPECIFIEDreligionhas an option forUNOBTAINABLEand forNOT SPECIFIEDmarital_statushas an option forUNKNOWN
Tidying up
The variable
diagnosisin the Hospital Admissions dataset could be called “un-tidy”, because some patients have multiple diagnoses listed in that one column. Suggest a way we might tidy up this variable.- We could make dummy variables for each possible diagnosis. For example, we would have a column called “Sepsis”, and it would have a 1 if the patient was diagnosed with Sepsis and a 0 if not.
Suppose we wanted to convert the
platelet_countvariable in the Platelet Count dataset to a binary variable. How would you suggest we do this?- We would combine the categories “Rare”, “Low”, “Very Low”, and “High” into “Abnormal”, so that there were only two options, “Normal” and “Abnormal”
The Cholesterol dataset is currently in wide form. What would it look like in long form? Specifically, what would be the variable names in long form, and what values would those variables contain?
- The new variables would be “Cholesterol Level”, which contains the numeric measurement in mg/dL, and “Cholesterol Type” which tells us whether this is a measurement for HDL or LDL type cholesterol.
Part Two: Estimating parameters to answer research questions
Summarizing categorical variables
Open the Platelet Count dataset. Click on the Column D, so that the whole column is highlighted. Then, in the dropdown menu at the top of the Google Sheets window, choose “Data > Column Stats”
- Report the summary statistics of the
platelet_countvariable.
Choose three categorical variables from the Hospital Admissions dataset, and provide summary statistics for those.
- (Need to report percentages, not just counts, for three categorical variables)
Summarizing quantitative variables
In the Blood Oxygen dataset, get the Column Stats for the oxygen_pct_value variable. Do the same for the LDL_value and HDL_value variables in the Cholesterol dataset. For each of those three variables, report the following:
The mean
The median
The mode
Whether the variable is left-skewed, right-skewed, or symmetric
Oxygen Percent Value
mean | median | mode |
|---|---|---|
86.98 | 96 | 98 |
slightly left skewed
LDL Cholesterol
mean | median | mode |
|---|---|---|
93.92 | 88.5 | 100 |
slightly right-skewed
HDL Cholesterol
mean | median | modes |
|---|---|---|
42.71 | 41 | 29, 43, 50 |
approximately symmetric
Defining the population
Think about the sample represented in these datasets. What would you say is the population that we can reasonably make claims about from this data?
Wrong answer: “The hospital admissions in this dataset.”
- The sample is the ones in the dataset; the population is beyond the data we’ve collected.
Okay answer: “People who were admitted to this hospital.”
We aren’t just studying people who were already admitted..
Also, our observations are not “people”, they are “admissions” - the same person could be admitted twice.
Good answer: “All admissions that could ever happen at this hospital.”
- We’d like to make a claim about the hospital in general, and all admissions it could have.
Not quite right: “All admissions that could happen at any hospital.”
- We’d like to be careful not to make claims about other hospitals when our data only comes from one. We’d need to have a really good reason to believe this hospital is representative of all others.
Parameters and Statistics
For each of the following research questions, state the parameter that would answer the question. (This will be a sentence describing an unknown number, such as “The true probability that Maria wins a game of Super Sisters.” or “The long-run average coins Maria would score.”)
Then, give the statistic that best estimates the parameter and addresses the question.
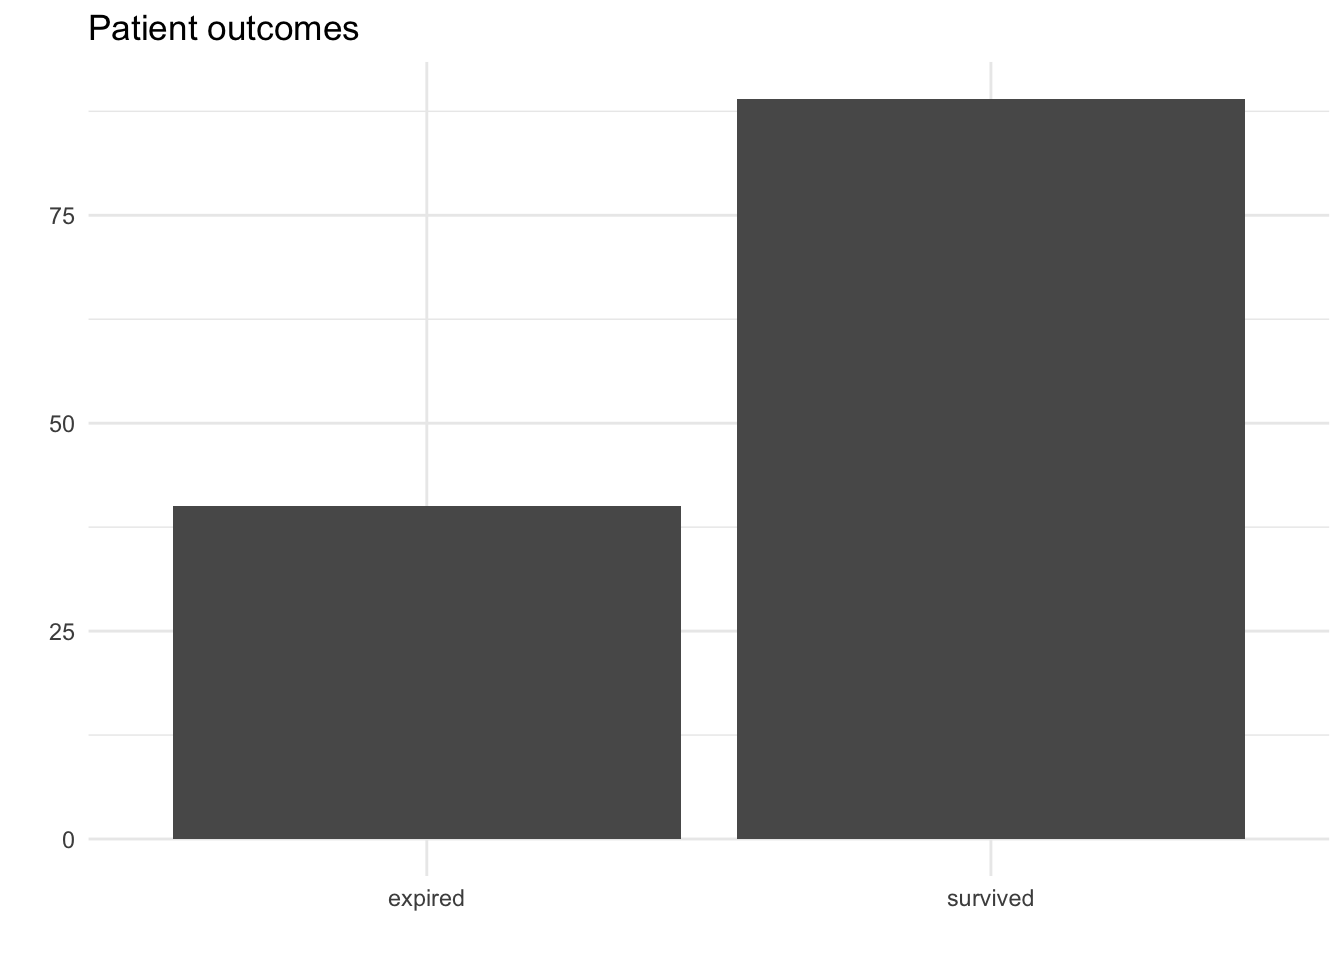
How many of the patients who are admitted to this hospital tend to survive?
Parameter: The probability that a patient admitted to the hospital survives.
Statistic: 67% of patient admissions in this dataset that ended in survival.
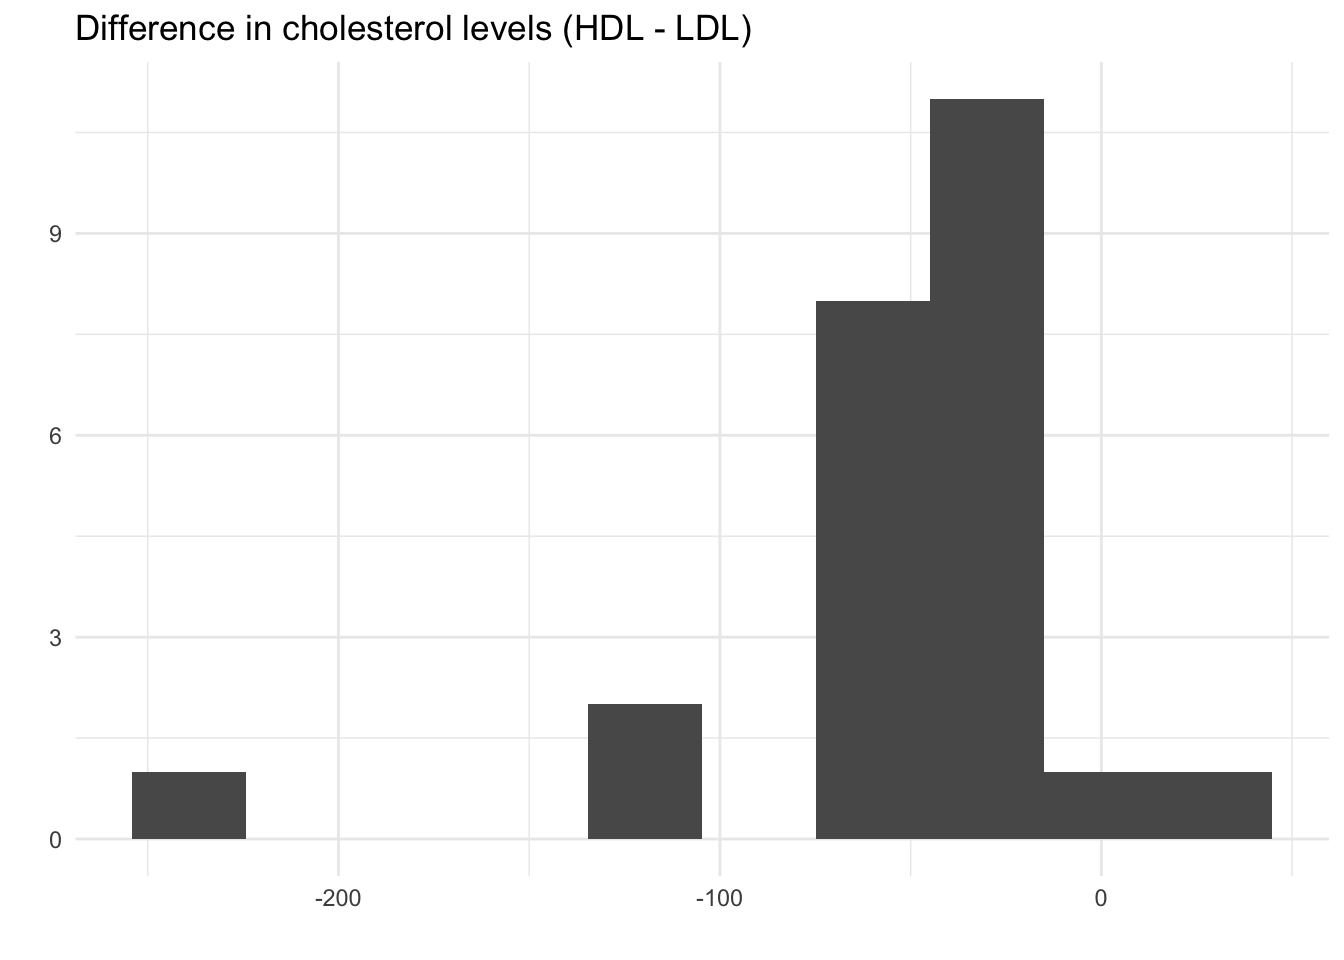
Do patients generally have more HDL cholesterol, or more LDL cholesterol? By how much?
Parameter: The true mean difference between HDL and LDL cholesterol for all tests that could ever be run.
Statistic: The mean HDL value was 42.71. The mean LDL value was 98.92. The difference is 56.21 higher LDL on average.
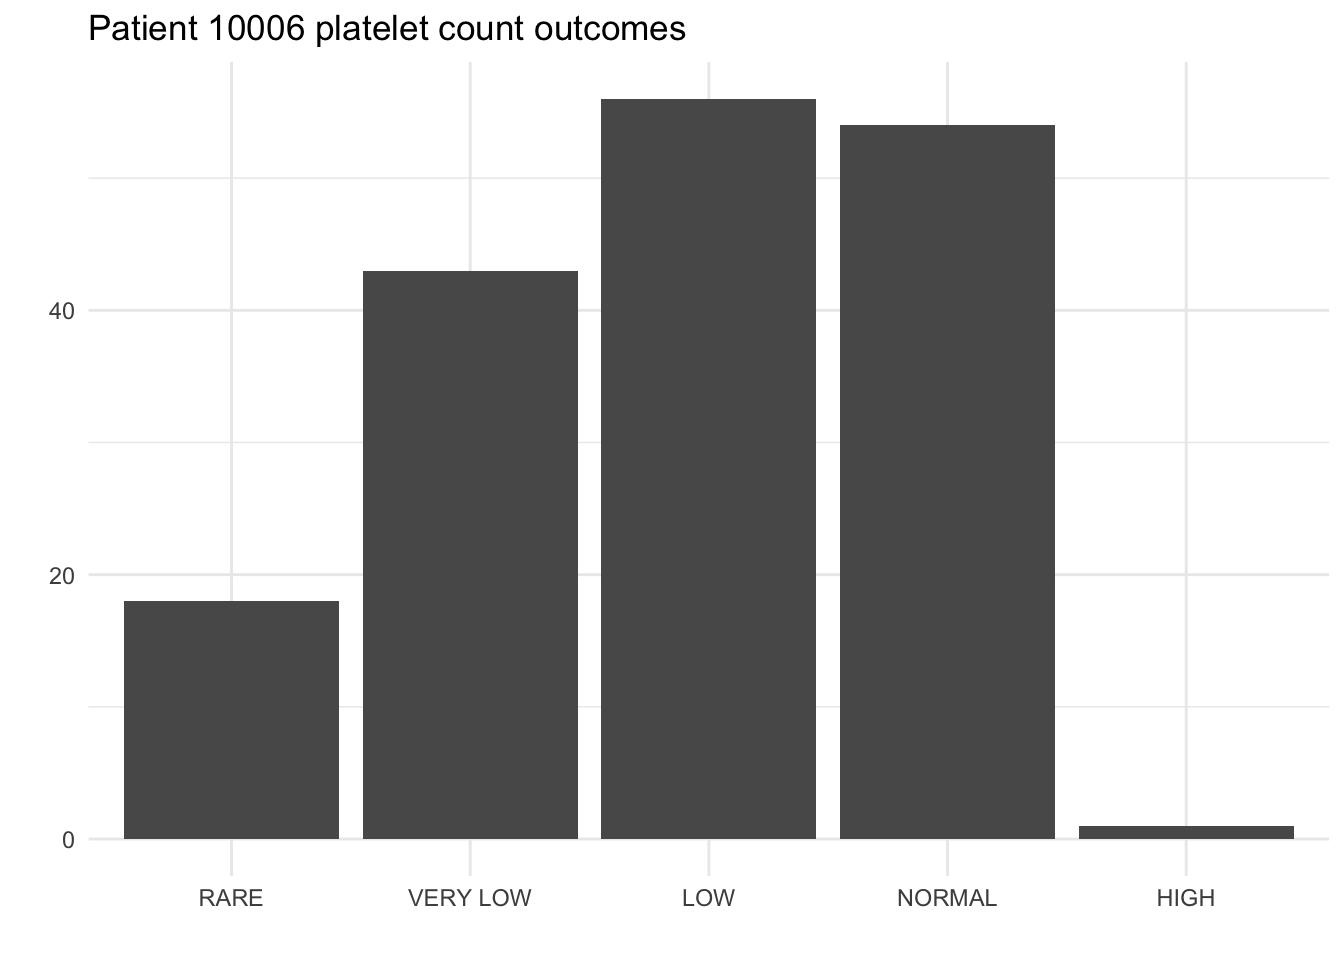
If they are measured again, do we expect Patient 10006 to have very low platelet count?
Parameter: “The probability that Patient 10006 has Very Low platelet count.” or “The long-run proportion of tests on Patient 10006 that result in Very Low count.”
Statistic: 30.7% of Patient 10006’s recorded tests resulted in Very Low count.
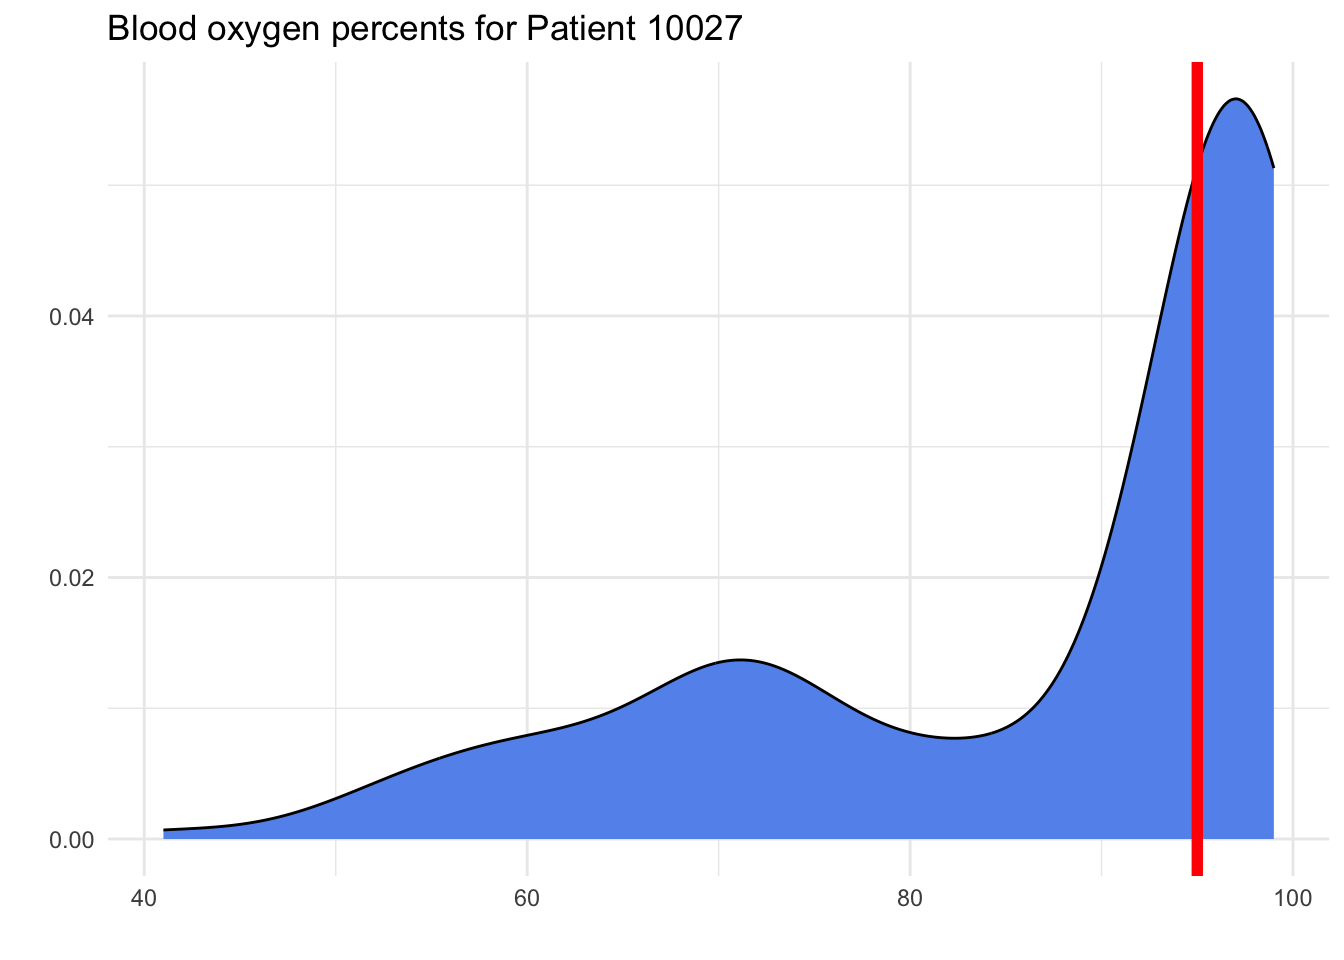
If they are measured again, do we expect Patient 10027 to have a blood oxygen percent below 95%?
Parameter: “The probability that Patient 10027 has blood oxygen below 95%” or “The long-run proportion of tests on Patient 10027 that result in blood oxygen below 95%.”
Statistic: 21.7% of Patient 10027’s recorded tests had oxygen percent below 95.
Asking Research Questions
Come up with three questions of your own. State the parameter that they refer to. Then, give a one-sentence summary making a conclusion from the data.
Part Three: Visualization
Consider again the research questions above:
- How many of the patients who are admitted to this hospital tend to survive?
- Do patients generally have more HDL cholesterol, or more LDL cholesterol? By how much?
- If they are measured again, do we expect Patient 10006 to have very low platelet count?
- If they are measured again, do we expect Patient 10027 to have a blood oxygen percent below 95%?
For each of these, sketch a plot that you would use to help address the research question. These can be rough sketches, but they should use the real data as much as possible - in Part Three, you calculated summary statistics to address these questions, and the plots you draw should match these statistics.
(You are also welcome to make these plots using software, if you would like, but this is not required - a simple sketch on paper or in a “draw on the screen” application like MS Paint is sufficient.)
Part Four: Putting it all together
Choose a research question of your own invention, i.e., not one of the four that supplied above. (It can be one of the ones from the end of Part Two, if you wish.)
Write a short report for an imaginary doctor, sharing your analysis of the research question. Your report should be one or two paragraphs long and include a sketched plot. You should make sure to address:
The data source
The variable types for the variable(s) relevant to your research question
A statement of the sample and population involved in the analysis
Parameters and summary statistics that address your research question
A final conclusion in “real world” terms - that is, what one sentence would you use as the “newspaper” headline to share your findings.