4 Gathering samples
Planning and collecting data
“The best and most beautiful things in this world cannot be seen or even heard, but must be felt with the heart.”
— Helen Keller
In our work so far, we have dealt with datasets that were already created. Now let’s take a couple steps back and think about how and why they were created.
Specifically, we want to establish:
How the observed cases were acquired
How the variables were measured and recorded
Where the time, expertise, and money to support the data collection came from
What ethical considerations we might have for the dataset
Recall that a dataset consists of cases on the rows and variables on the columns, and that we regard the cases in the dataset to be a sample from a larger population. The question, then, is: how did these specific cases end up being chosen to be studied? What was the sampling method that researchers used to select their sample?
For example, suppose we want to find out if a particular proposition on the ballot in California, “Prop A”, is going to pass. That is, we want to know if at least 50% of people are going to vote yes on Prop A.
The parameter that would answer this question is: The true percent of voters who vote yes on Prop A. Of course, we can’t know what that number is before the election actually takes place, so we will instead need to try to estimate the parameter from a sample.
4.0.1 Convenience sample
Alright, so how do we access some voters so we can ask them if they will vote for Prop A? Well, most of us know at least a few people who live in California. Maybe we can call them up and ask them how they plan to vote.
This approach - sampling the cases that are easiest to access - is called a convenience sample.
The advantage of convenience sampling is, as the name suggests, that it is quick and convenient. We might save a lot of time and money and effort by taking this approach.
However, we should be worried that our sample is not representative of the population. It is likely that it is biased in some way: this sample consists of cases that are similar in some way that is important to the research question.
Those friends in California who you called most likely have similar political opinions to you, overall. If you support Prop A, they probably do to. Thus, we might conclude based on the convenience sample that Prop A is likely to pass, even though most voters don’t actually support it!
To justify using a convenience sampling approach, it is important to make a clear argument for why the convenience does not lead to bias.
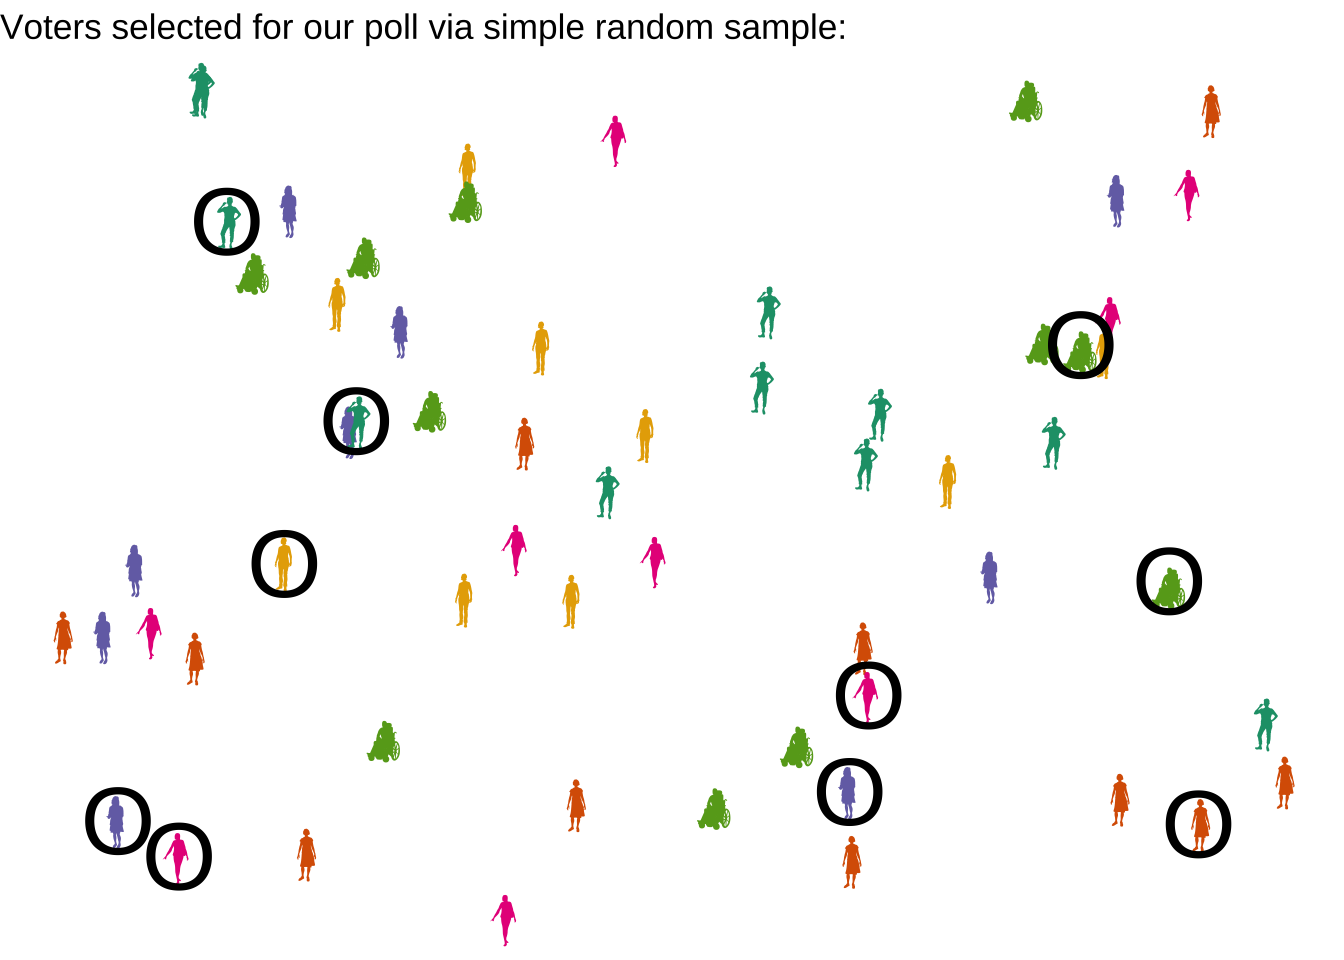
4.0.2 Simple random sample
In an ideal world, to avoid bias, we could simply make a list of every single case in the population, and then choose our sample completely at random, so that each member of the population is equally likely to end up in the dataset. This is called a simple random sample, or SRS.
In real life, this is usually only approximately possible. Suppose we have a list of all voters in California, and their phone numbers. Then, we could use a computer program to randomly select 1000 of those voters, call them up, and ask them how they plan to vote in the election.
Did we really achieve an SRS here? Close, but technically not quite.
Let’s think about the population we are studying here. Is it all people in California who are registered to vote? No, our population is all people in California who will vote in the election for Prop A. In fact, when we used the list of registered voters, we took our SRS from a larger population than the one we want to study.
But will this lead to bias? Not necessarily. It is probably reasonable to believe that the population of registered voters is similar to the population of actual voters.
4.0.3 Cluster or Multistage sample
A slight variation on the SRS comes about when it is a bit easier to sample in batches. For example, suppose our list of registered voters is supplied separately by each county. It might be easier to randomly choose only a few counties, and then perform an SRS on the voters from those counties.
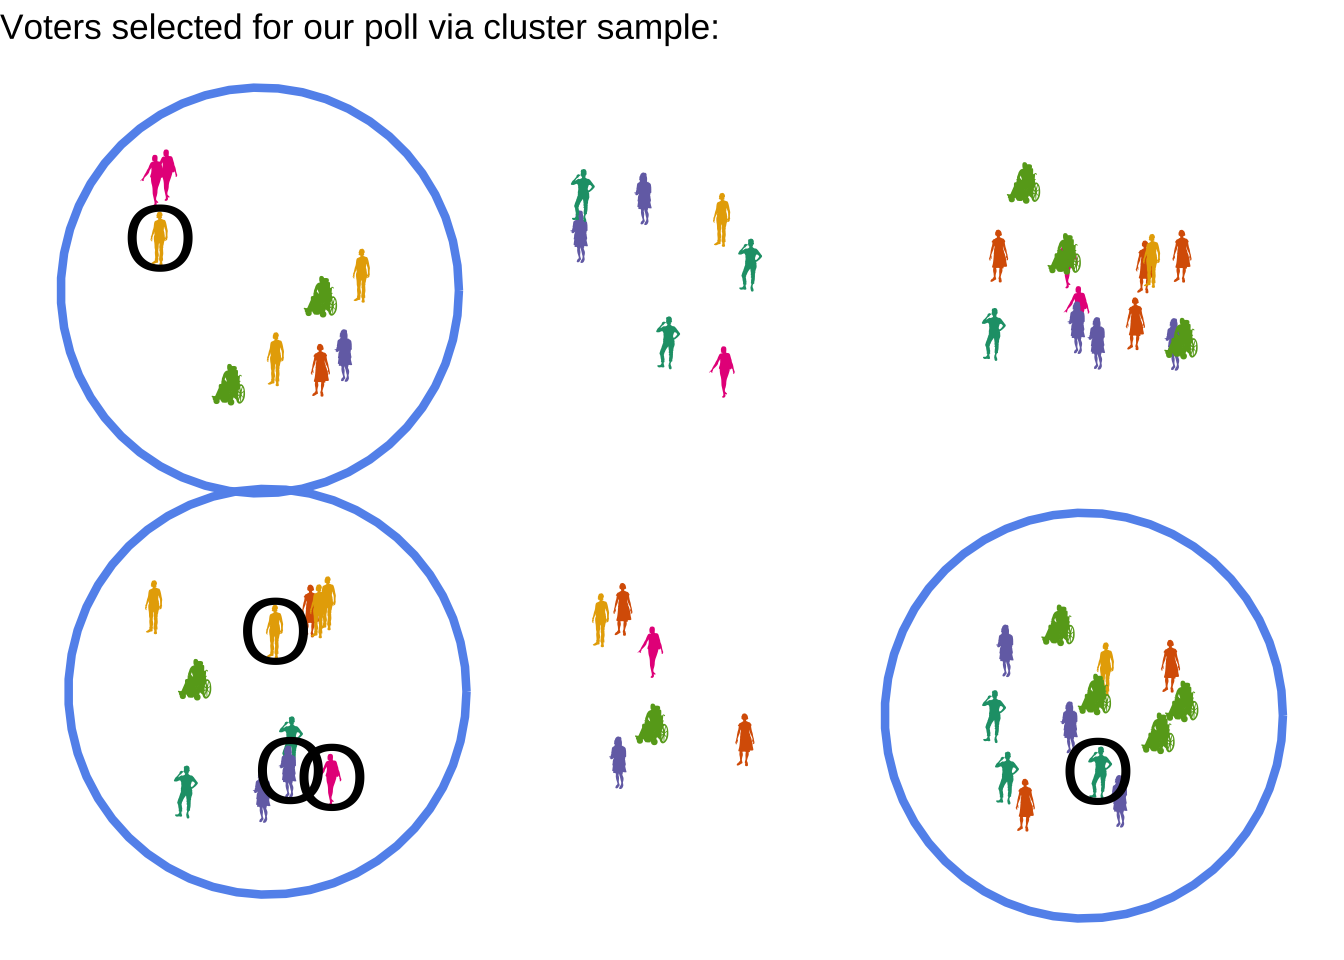
We have to be cautious with this approach. Although it can save time, effort, and/or money, it also comes with risk. If the groups used for the clusters - in this case, the the counties - are meaningfully different from each other, then we might be in danger of sampling only from groups with similar opinions.
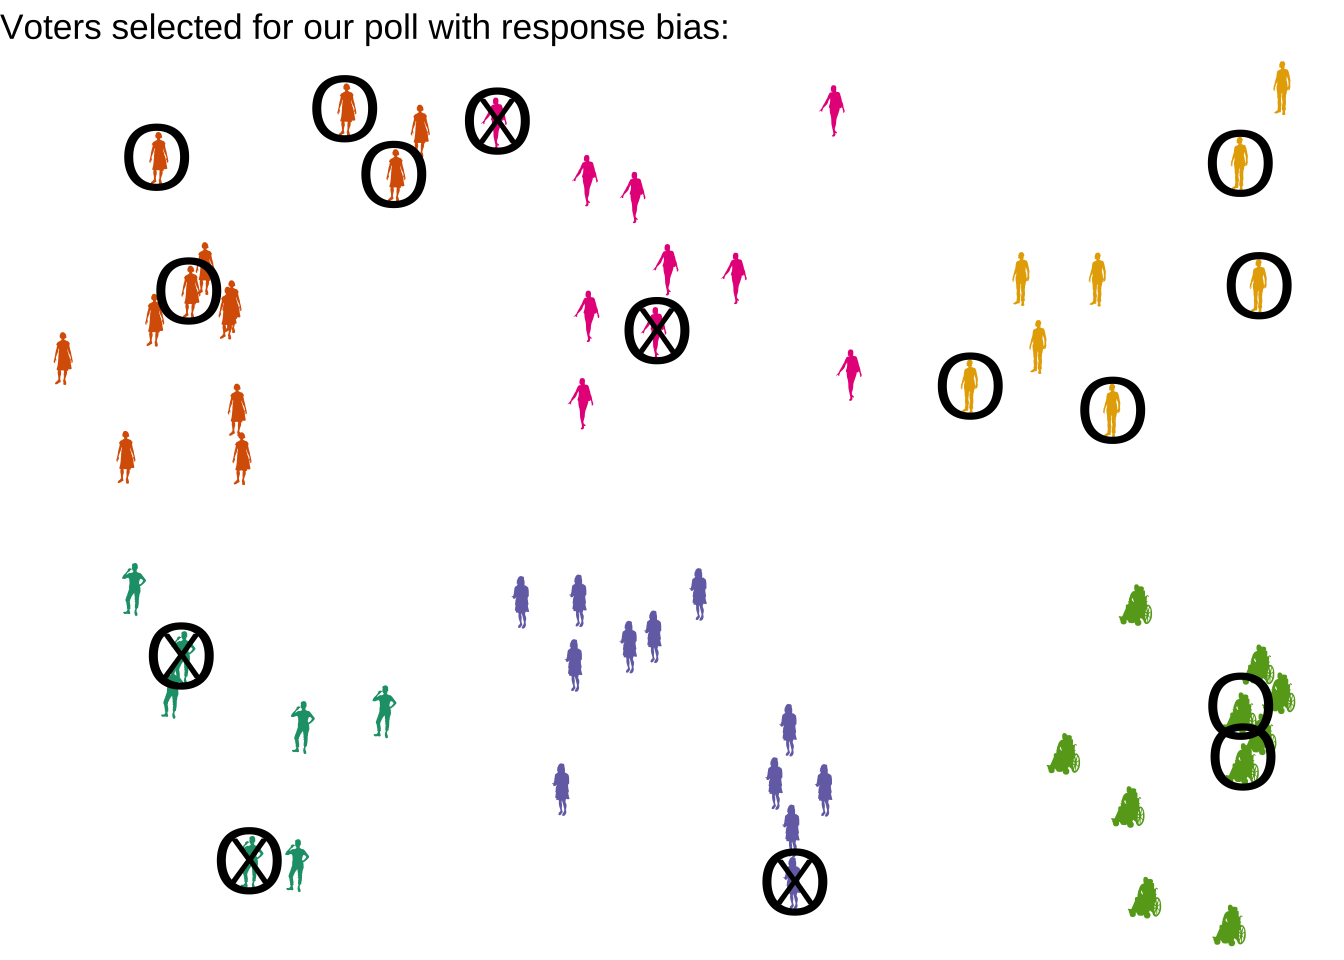
4.0.4 Nonresponse, voluntary response, false response bias, and undercoverage
In our examples above, we assumed that we could call up every registered voter who was sampled by the SRS, and find out how they planned to vote on Prop A. There are a few ways that assumption could be false.
4.0.4.1 Nonresponse bias
First, some of the sampled individuals might not pick up the phone, or they might have outdated phone numbers listed. We might then have some bias in our sample, if there is a reason to believe that the type of people not picking up the phone are different from those who are likely to pick up. For example, if we called during traditional work hours (9-5), we would be less likely to reach a person who works a day job. If Prop A relates to labor laws, it’s very possible day workers have different opinions on average from those who do not work 9-5.
4.0.4.2 Voluntary response bias
Second, some individuals who pick up the phone might refuse to participate in our poll. Once again, this might lead to bias if there is a meaningful difference between people who respond and those who do not. For example, a stay-at-home parent may not able to spend the time on the phone to answer our questions while caring for a small child. If Prop A relates to childcare or family law, stay-at-home parents might have different opinions on average than working parents or individuals without children.
4.0.4.3 False response bias
Thirdly, we need to be careful not to design the questions that we ask in such a way that our respondents give dishonest answers. Consider the difference between the question:
“Are you planning to vote for Prop A, which will increase support programs for working parents, in the coming election?”
or
“Are you planning to oppose Prop A, which will cost the state $60 million, in the coming election?”
Even though Prop A is a made up example, didn’t those phrasings make you feel differently about it?
In this book, we will not go in-depth into principles of survey design; we simply ask that you be aware of the possibility of bias due to the way the data itself is collected.
4.0.5 Undercoverage bias
Lastly, it’s possible that our sampling method simply failed to capture an entire part of the population. For example, if we are doing our Prop A poll in advance of the election, what about people who have not yet registered to vote, but will soon? These people are not on our voter registration list, so we could not possibly have chosen them for our sample. We had an undercoverage issue, where parts of the population were not accessible to us.
4.0.6 Stratified random sample
If certain subpopulations, like “stay-at-home parents” or “9-5 workers”, are more difficult to get responses from, how can we ensure ourselves a representative sample?
One solution is to divide our population into strata, or meaningful groups, and make sure we get some samples from each group.
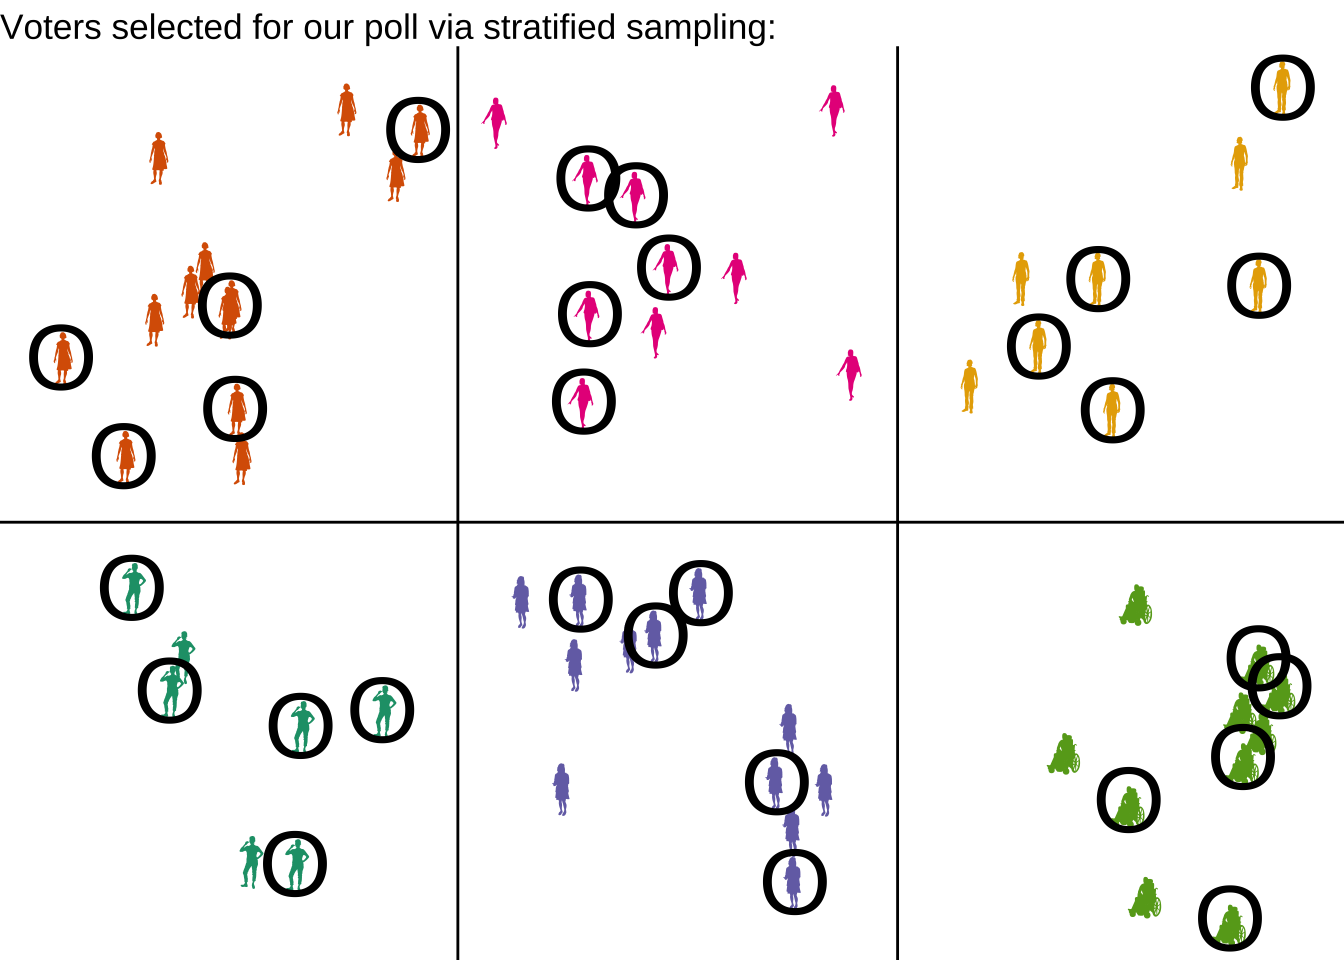
Using stratified sampling guarantees that our sample is equally spread across all the subpopulations. In essence, we are collecting one additional variable in our data: the categorical variable of the strata.
For example, in an election poll, it is common to stratify by political party. Instead of reporting the overall support for Prop A, we might report the percent of Republicans, Democrats, Independents, etc. who we expect to vote yes on Prop A.
4.1 Planning experiments
All the data we have studied so far has been observational data, meaning that we take a sample and record information about it, but we do not actively try to effect the information.
Some data, however, comes not from observing the state of the world and asking questions, but from an experiment.
Although you may never conduct an experiment yourself, let’s learn how to plan one, so that we can understand and describe where data comes from.
4.1.1 Treatments and Control
The purpose of conducting an experiment is to study the impact of certain treatments that are applied to the experimental units or subjects in the study.
Let’s suppose our goal is to study two medicines that claim to improve brain function, the red pill and the blue pill. To test these medicines, we will collect a sample of subjects willing to participate in the study, and we will give some of them the treatment of the red pill, and others the treatment of the blue pill.
But wait - we don’t just want to know which pill is better! It’s possible that neither of them helps at all. Thus, it is smart to include a third treatment, the control group that will take neither pill. This control group gives us a baseline to compare to.
4.1.2 Blocking
Before we split up our subject into the three treatments, we need to decide if there are any groups that we should study separately. For example, perhaps the red pill is expected to work better for adults, and the blue pill is expected to work better for children.
If meaningful groups seem to exist, it would be wise to block our subjects before assigning treatments, and then assign the three treatment groups separately within each block.
4.1.3 Randomization
Now, how will we determine which of the adults and which of the children get each of the treatments?
The answer is simple, but important: Treatments must be assigned randomly.
If we assign treatments in a meaningful way, we run the risk of confusing those trends for actual experimental results. For example, suppose we decide to give female-identifying subjects the red pill; male-identifying subjects the blue pill; and non-binary subjects neither pill. We then observe that the red pill leads to higher brain function than the red pill. Do we really know that it was the pill type that caused the higher brain function? Or is it possible that female-identifying humans naturally react more strongly to any pill?
4.1.4 Blinding
Time and time again, studies have shown that human brains have a remarkable ability to impact physical existence. If a person is told that pill will help their brain function, they are far more likely to show actual measurable increase in brain function. Since our goal is to isolate the physical effect of the pill, we want to avoid any psychological effects. Thus, it is important to use blinding, meaning we prevent our subjects from knowing which treatment group they are in.
What about the control group, then? Well, ideally, they would also be ignorant of their treatment. We can accomplish this by giving them a placebo: a fake version of the treatment that actually has no effect, such as a sugar pill.
Because the psychological ability to react to nonexistent treatment is so strong, we sometimes call this phenomenon the placebo effect.
But the dangers of subtle human psychology don’t stop there. It’s also true that the researchers themselves can subconsiously impact outcomes, even if they don’t mean to. For example, a researcher who knows their subject has taken the blue pill might ask more questions or use a more excited tone, leading to a different experience for the subjects based on treatment. If possible, we also implement blinding on any researchers involved in administering the treatments or measuring the outcomes.
When we successfully hide the treatment assignments from both the researchers and the subjects, we call this double-blinding.
4.2 Causation and lurking variables
4.2.1 Cautionary tale: Red wine and heart health
For a long time, the scientific community believed that drinking a glass of red wine a day lead to lower cholesterol. This belief was based on many observational studies in which the mean cholesterol levels of people who drank red wine was lower than the mean levels for those who did not.
Does this really mean that drinking red wine causes one’s cholesterol to go down? It turns out that the answer is probably “no”.
Why not?
Imagine for a moment the lifestyle of a person who drinks a glass of red wine a day. Is this person wealthy? If you’re like me, you probably imagined someone living an upper class lifestyle.
It turns out that instinct is correct - the population of people who drinks red wine daily is, in general, a wealthier population than the general public. Many other measurements are often associated with wealth; in particular, diet and health are typically better for those in the upper classes.
In this scenario, we ran into the problem of a lurking variable: a variable that was not measured in the data, but that influences the variables that we are trying to study. Our lurking variable in this case was the subjects’ wealth - wealthiness was associated with drinking wine, and also associated with health factors like cholesterol.
4.2.2 Claims of causation
Given the danger of lurking variables, when can we make causal claims from data?
If our data is observational, we can never make these claims. We’ll never know if the pattern we observe - such as lower cholesterol in red wine drinkers - is actually caused by an unrecorded lurking variable.
If our data is experimental, however, we actually can strengthen our claim. In our blue/red pill experiment, if we observe that the blue pill group had higher brain function, we can argue that the blue pill causes the effect. This is because the subjects were randomly assigned to the treatments, so it is not possible for a lurking variable to be associated with the treatment group. For example, we aren’t at risk of a subject taking the blue pill because they are wealthier.
Therefore, if we have a well-designed experiment, that is blinded and uses random assignment, on a sample that is representative of the population we are making claims about - then, and only then, can we say that our results are a cause-and-effect relationship.
4.3 Data Ethics
Last, but certainly not least, we need to take a moment to consider the human element in data. Any time you acquire or create a new dataset for analysis, there are a few important questions you should ask.
4.3.1 Source and Motivation
Collecting data and conducting experiments requires resources, in the form of time, money, supplies, equipment, etc. It is good to understand where those resources came from. A good dataset should always make it clear:
- Who collected the data?
- Were they qualified to do so?
- Do they have an inherent biases that might impact their work?
- Do they have any conflicts of interest?
- How was the data collected or created?
- Did they record the data in a responsible way?
- Did they design the experiment properly?
- Did the subjects consent to being studied?
- Who funded the collection or experiment?
- What did they stand to gain from the process?
- Where did they get the money to fund it?
- Are they expecting anything in return?
- What did they stand to gain from the process?
- Why did those involved want the data to be created or collected?
- Is there a specific conclusion they are hoping to draw?
- How do they stand to benefit from the analysis?
- How will they publicize their results?
- Is there a specific conclusion they are hoping to draw?
4.3.2 Impact and Implications
Even when the motivation for the data collection is honest and responsible, there can be unintended impacts of any analysis. Before moving forward with a study, ask yourself:
- Has anyone already been harmed by the data creation?
- Were the subjects in the experiment treated humanely and kindly?
- Were they informed of their legal rights?
- Has their privacy been respected?
- Who could be harmed by the results?
- How will the results of your study be used?
- Could publicizing the results jeopardize privacy of subjects?
- How could the results be misinterpreted in dangerous ways?
- Are there any marginalized groups that are underrepresented in the data?
- Who could be helped by the results?
- Could this data be used for social good?
- How might your conclusions improve life for a society or group?
- Can this study increase understanding or education of a topic?
4.3.3 Reproducibility
A good scientific study should always have the “three R’s” of responsible analysis:
Repeatability: If I do the same study, with the exact same sample and methods, I should get the exact same results.
Replicability: If I study the same questions, but with my own sample and methods, I should arrive at similar conclusions.
Reproducibility: It should be possible for me to do the same study, using the same methods and analysis, but with a different sample.
To achieve a reproducible analysis - that hopefully will be repeated and replicated by other researchers - it is important to document your process.
This means that every step of the analysis should be well-explained, including the data collection and cleaning. It also means that any coding or software steps should be written down and shared (if possible) for future use.
A good thought experiment for ensuring reproducibility is: Imagine that halfway through your study, you suddenly lose your memory. Would you be able to read your documentation, use it to re-acquire your data and re-run your analyses, and continue working where you left off? If not, perhaps you need a bit more clarification!