name | height | mass | hair_color | eye_color | age | gender | homeworld | from_tatooine |
|---|---|---|---|---|---|---|---|---|
Luke Skywalker | 172 | 77.0 | blond | blue | 19.0 | masculine | Tatooine | 1 |
Darth Vader | 202 | 136.0 | none | yellow | 41.9 | masculine | Tatooine | 1 |
Leia Organa | 150 | 49.0 | brown | brown | 19.0 | feminine | Alderaan | 0 |
Owen Lars | 178 | 120.0 | brown | blue | 52.0 | masculine | Tatooine | 1 |
Beru Whitesun Lars | 165 | 75.0 | brown | blue | 47.0 | feminine | Tatooine | 1 |
Biggs Darklighter | 183 | 84.0 | black | brown | 24.0 | masculine | Tatooine | 1 |
Obi-Wan Kenobi | 182 | 77.0 | auburn | blue-gray | 57.0 | masculine | Stewjon | 0 |
Wilhuff Tarkin | 180 | auburn | blue | 64.0 | masculine | Eriadu | 0 | |
Han Solo | 180 | 80.0 | brown | brown | 29.0 | masculine | Corellia | 0 |
Wedge Antilles | 170 | 77.0 | brown | hazel | 21.0 | masculine | Corellia | 0 |
Palpatine | 170 | 75.0 | grey | yellow | 82.0 | masculine | Naboo | 0 |
Boba Fett | 183 | 78.2 | black | brown | 31.5 | masculine | Kamino | 0 |
Lando Calrissian | 177 | 79.0 | black | brown | 31.0 | masculine | Socorro | 0 |
Lobot | 175 | 79.0 | none | blue | 37.0 | masculine | Bespin | 0 |
Mon Mothma | 150 | auburn | blue | 48.0 | feminine | Chandrila | 0 | |
Arvel Crynyd | brown | brown | masculine | |||||
Raymus Antilles | 188 | 79.0 | brown | brown | masculine | Alderaan | 0 |
1.2 Exercises
Exercise 1.2.1
The following dataset contains information about human characters in the Star Wars original trilogy.
Use this dataset to calculate summaries to answer the following questions:
- Are most characters in Star Wars from the planet Tatooine?
- What is the gender balance of Star Wars characters?
- What color hair do Star Wars characters tend to have?
- What color eyes do Star Wars characters tend to have?
- How many Star Wars characters are older than 30?
Exercise 1.2.2
Continue to reference the Star Wars data to answer the following questions:
- What is the average height (in centimeters) of Star Wars characters?
- What is the average weight (in kilograms) of Star Wars characters?
- What is the average age of Star Wars characters?
- What is the mean of the
from_tatooinevariable? What does this number tell you?
Exercise 1.2.3
- The following chart shows the values of the
heightvariable from the Star Wars dataset on a number line:
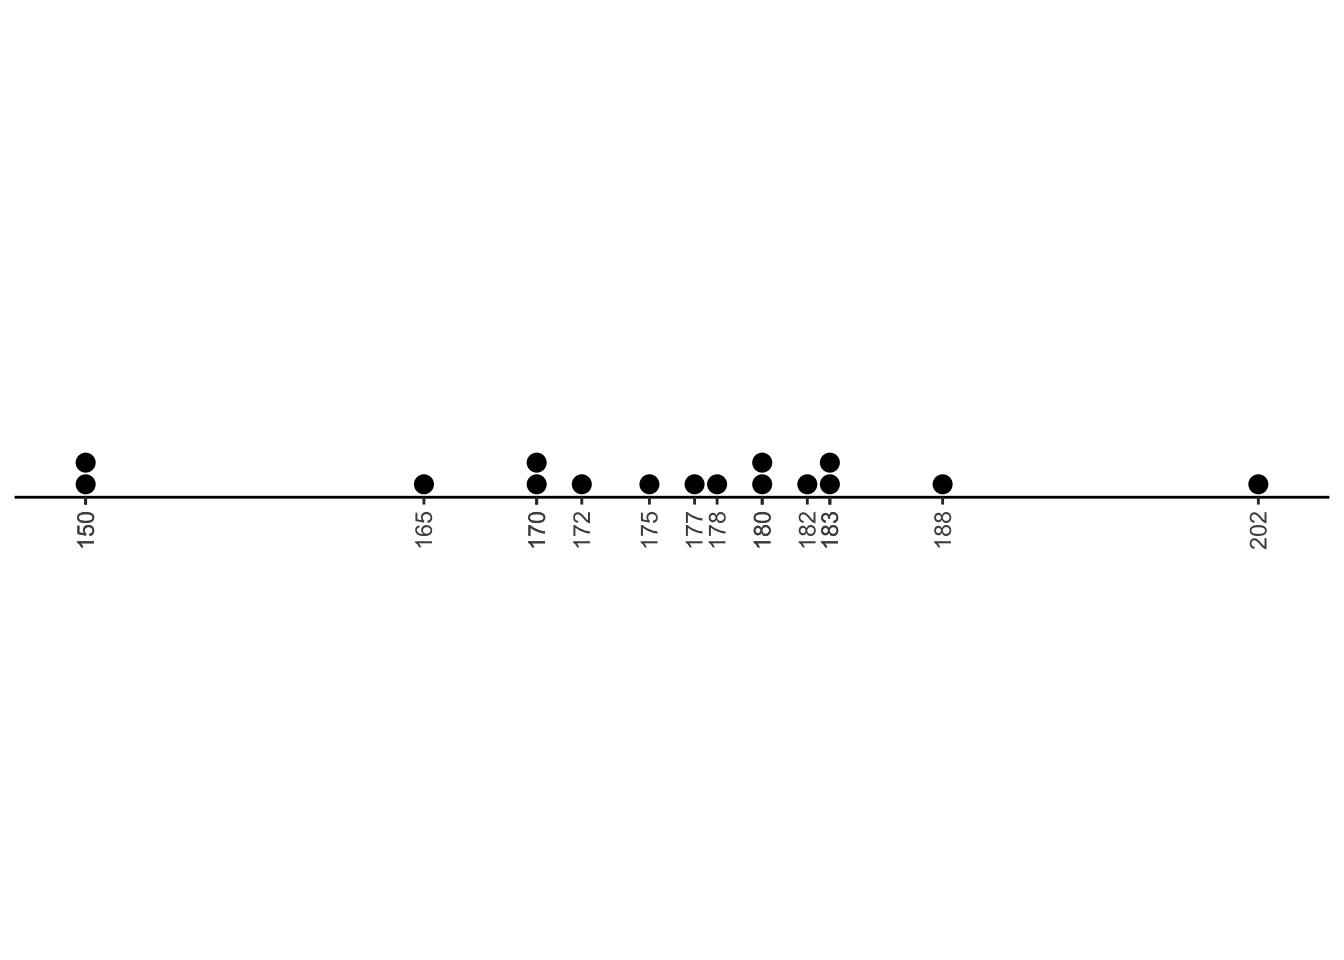
We would call this variable:
(a) Skewed right
(b) Skewed left
(c) Symmetric
- The following chart shows the values of the
agevariable from the Star Wars dataset on a number line:
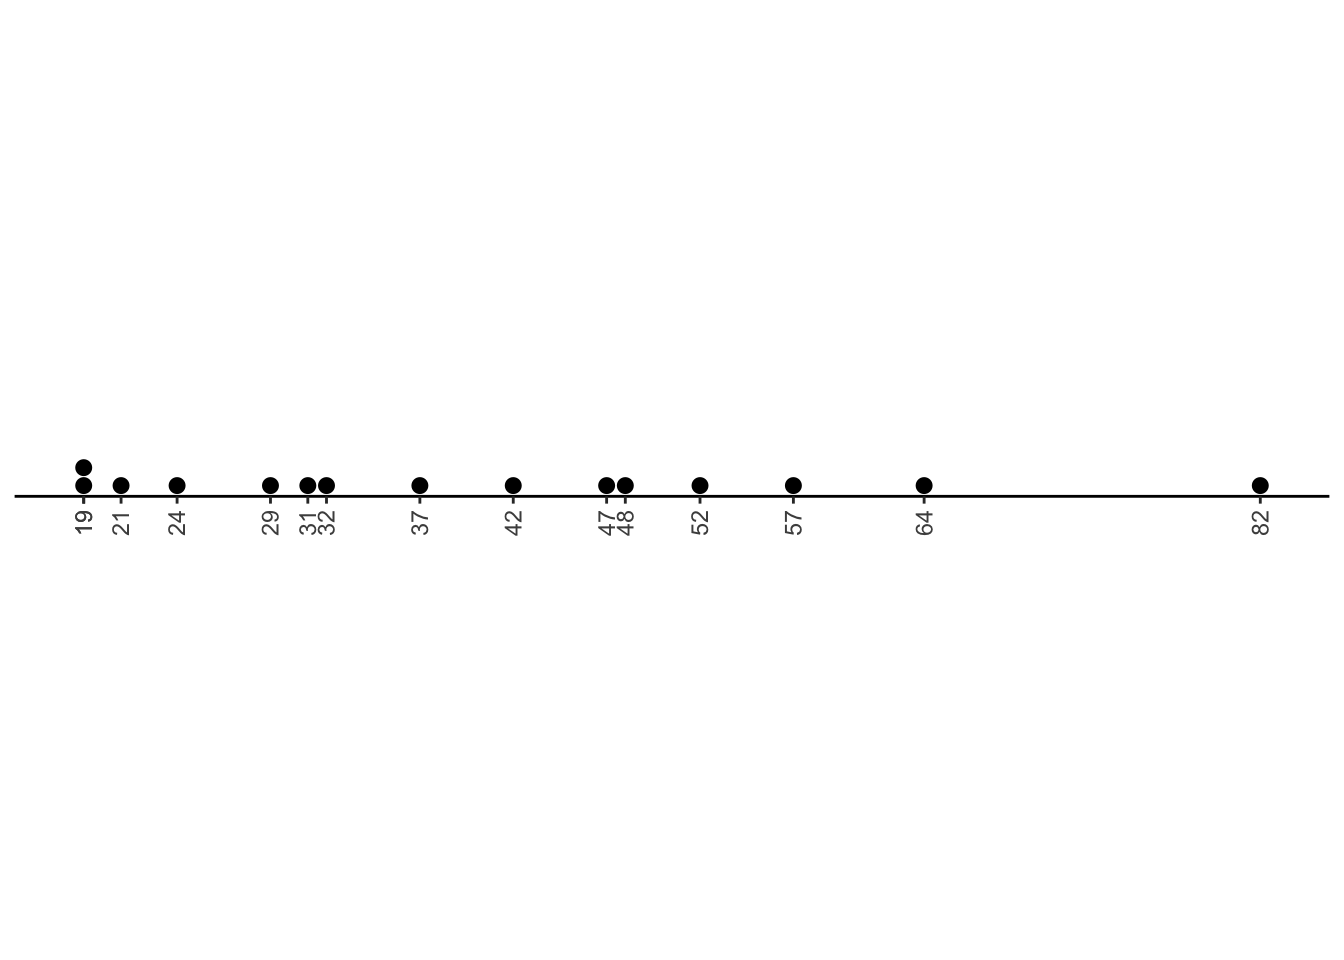
We would call this variable:
(a) Skewed right
(b) Skewed left
(c) Symmetric
- The Star Wars dataset contains only information about human characters. However, these movies also contain many aliens and robots. One of the aliens is a large sluglike character named “Jabba the Hutt”:
name | height | mass | hair_color | eye_color | age | gender | homeworld | from_tatooine |
|---|---|---|---|---|---|---|---|---|
Jabba Desilijic Tiure | 175 | 1358 | orange | 600 | masculine | Nal Hutta | 0 |
How do the means and medians of the height, mass, and age variables change when you include Jabba in the data?
Exercise 1.2.4
- The Star Wars dataset contains all the named human characters from the original movies. If we consider this dataset to be a representative sample, what would be the best description of the population.
All characters, human or not, in the original trilogy.
All human characters that the creators of Star Wars could have invented for the movies.
All characters from science fiction movies that are human.
All the human characters who appear in any of the nine Star Wars movies, not just the original trilogy.
Exercise 1.2.5
Recall the flights dataset from Exercises 1.1. The first few rows of the dataset are shown here:
year | month | day | dep_time | sched_dep_time | dep_delay | arr_time | sched_arr_time | arr_delay | carrier | flight | tailnum | origin | dest | air_time | distance | hour | minute | time_hour |
|---|---|---|---|---|---|---|---|---|---|---|---|---|---|---|---|---|---|---|
2013 | 1 | 1 | 517 | 515 | 2 | 830 | 819 | 11 | UA | 1545 | N14228 | EWR | IAH | 227 | 1400 | 5 | 15 | 2013-01-01 05:00:00 |
2013 | 1 | 1 | 533 | 529 | 4 | 850 | 830 | 20 | UA | 1714 | N24211 | LGA | IAH | 227 | 1416 | 5 | 29 | 2013-01-01 05:00:00 |
2013 | 1 | 1 | 542 | 540 | 2 | 923 | 850 | 33 | AA | 1141 | N619AA | JFK | MIA | 160 | 1089 | 5 | 40 | 2013-01-01 05:00:00 |
2013 | 1 | 1 | 544 | 545 | -1 | 1004 | 1022 | -18 | B6 | 725 | N804JB | JFK | BQN | 183 | 1576 | 5 | 45 | 2013-01-01 05:00:00 |
2013 | 1 | 1 | 554 | 600 | -6 | 812 | 837 | -25 | DL | 461 | N668DN | LGA | ATL | 116 | 762 | 6 | 0 | 2013-01-01 06:00:00 |
2013 | 1 | 1 | 554 | 558 | -4 | 740 | 728 | 12 | UA | 1696 | N39463 | EWR | ORD | 150 | 719 | 5 | 58 | 2013-01-01 05:00:00 |
- For each of the following quantities, state whether it is a parameter or a statistic:
The average of the numbers in the
air_timecolumn.The true average departure delay of United flights from NYC.
The probability that a flight from EWR will arrive late.
The proportion of flights in this dataset that were international.
The average air time of a flight from LGA to LAX.
The number of observed flights in 2013 that took more than 5 hours.
How late we should expect our flight to be if we fly from JFK to ATL in December.
The percentage of flights from the NYC area that will turn out, in the long run, to arrive late.
- For each of the following research questions, state the parameter that would best answer the question. This answer will be a sentence describing one or more unknown quantities, such as “The probability that Maria wins her next game of Super Sisters.”
Should I fly out of LGA airport or JFK airport, if I want to arrive at SFO on time?
How long does it take to fly from New York to San Francisco?
Are flights more likely to have takeoff be delayed in the Winter months (Dec-Feb) than in the Summer months (June-August)?
- For the three research questions above, describe how you would calculate a statistic from the
nycflights13dataset to estimate that parameter. (You do not have to actually calculate the statistic; only describe your process, like “I would calculate the median of thehourvariable.”)