Name | Album | Artist | Acoustic | Danceability | Duration | Energy | Explicit | Live | Loudness | Mode | Speechiness | Tempo | TimeSignature | Valence |
|---|---|---|---|---|---|---|---|---|---|---|---|---|---|---|
P.L.U.C.K. | System Of A Down (Bonus Pack) | system of a down | FALSE | 0.267 | 217133 | 0.931 | TRUE | FALSE | -4.087 | 1 | 0.3050 | 159.759 | 4 | 0.1170 |
Kim | The Marshall Mathers LP | eminem | FALSE | 0.587 | 377893 | 0.923 | TRUE | FALSE | -3.050 | 0 | 0.4410 | 142.075 | 4 | 0.0778 |
Never Gonna Leave This Bed - Acoustic Version | Hands All Over (Deluxe) | maroon 5 | FALSE | 0.705 | 202320 | 0.688 | FALSE | FALSE | -5.773 | 1 | 0.0415 | 114.943 | 4 | 0.5980 |
Waking Up In Vegas | One Of The Boys | katy perry | FALSE | 0.524 | 199187 | 0.878 | FALSE | FALSE | -3.108 | 0 | 0.0346 | 130.989 | 4 | 0.5900 |
Intro - Main Version - Explicit | Idlewild | outkast | TRUE | 0.483 | 132027 | 0.506 | TRUE | FALSE | -14.899 | 0 | 0.3600 | 159.825 | 4 | 0.4660 |
Ur So Gay - Live At MTV Unplugged, New York, NY/2009 | Unplugged (Live At MTV Unplugged, New York, NY/2009) | katy perry | FALSE | 0.536 | 264213 | 0.651 | FALSE | TRUE | -5.828 | 0 | 0.1480 | 159.833 | 4 | 0.2660 |
Burn the Witch | A Moon Shaped Pool | radiohead | FALSE | 0.541 | 220609 | 0.847 | FALSE | FALSE | -6.520 | 1 | 0.0297 | 148.937 | 4 | 0.6200 |
All In It | Purpose (Deluxe) | justin bieber | FALSE | 0.356 | 231413 | 0.707 | FALSE | FALSE | -7.546 | 0 | 0.0990 | 136.250 | 5 | 0.5060 |
White As Snow | No Line On The Horizon | u2 | TRUE | 0.402 | 281067 | 0.308 | FALSE | FALSE | -11.615 | 0 | 0.0290 | 173.755 | 4 | 0.1400 |
Roman's Revenge - Album Version (Edited) | Pink Friday (Deluxe) | nicki minaj | TRUE | 0.817 | 276173 | 0.947 | FALSE | FALSE | -2.881 | 1 | 0.2900 | 112.364 | 4 | 0.4650 |
Case Study: Spotify Albums
Introduction
In this Case Study, we will analyze properties of popular music, based on measurements taken by the streaming service Spotify. For every song that is available on Spotify, automatic measurements are taken of certain musical and sound-based properties. These include:
- mode: Mode indicates the modality (major = 1 or minor = 0) of a track, the type of scale from which its melodic content is derived.
- tempo: The overall estimated tempo of a track in beats per minute (BPM). In musical terminology, tempo is the speed or pace of a given piece and derives directly from the average beat duration.
- loudness: The overall loudness of a track in decibels (dB).
- acoustic: Whether or not a track is acoustic (i.e., played without any background instruments or noises).
- live: Whether or not the track was performed live.
- duration: How long the song is in seconds
- explicit: Whether the song involves explicit words
- danceability: Danceability describes how suitable a track is for dancing based on a combination of musical elements including tempo, rhythm stability, beat strength, and overall regularity.
- energy: Energy is a perceptual measure of intensity and activity.
- valence: A measure describing the musical positiveness conveyed by a track. Tracks with high valence sound more positive (e.g. happy, cheerful, euphoric), while tracks with low valence sound more negative (e.g. sad, depressed, angry).
- speechiness: How much the song involves speaking a lot of words.
- time signature: The beat pattern of the song (0, 1, 2, 3, or 4).
We will use a smaller version of a dataset gathered from Spotify’s service by a former Cal Poly student. The full data, and information about it, can be found here: https://www.kaggle.com/danield2255/data-on-songs-from-billboard-19992019
The cases of this dataset are Albums, not individual songs. All measurements are averaged over the songs in the album, except: * Whether an album is considered Live or Acoustic depends on whether more than half the songs on the album are Live or Acoustic. * The Duration is the length in seconds of the full album.
A few rows (not all of them!) of the dataset are shown here:
Data Apps and Tables
To address the questions in this case study, you will of course need to calculate some summary statistics and estimated measurements from the dataset. Rather than giving you these summaries ahead of time, or asking you to calculate them by hand, we have provided for you a web application that will let you decide which statistics to calculate, then the calculation will be done for you.
Since correlations are a bit more complicated, here is a table of the sample correlations between all quantitative variables:
Variable | Danceability | Duration | Energy | Loudness | Speechiness | Tempo | Valence |
|---|---|---|---|---|---|---|---|
Danceability | 1.00000000 | 0.048073809 | -0.07955758 | 0.07357243 | 0.18028556 | -0.220553226 | 0.32204309 |
Duration | 0.04807381 | 1.000000000 | -0.00956553 | 0.01114260 | -0.07796373 | 0.004695732 | -0.17626606 |
Energy | -0.07955758 | -0.009565530 | 1.00000000 | 0.73587747 | 0.05387733 | 0.169815148 | 0.38158658 |
Loudness | 0.07357243 | 0.011142596 | 0.73587747 | 1.00000000 | -0.04918635 | 0.136233201 | 0.29612644 |
Speechiness | 0.18028556 | -0.077963730 | 0.05387733 | -0.04918635 | 1.00000000 | 0.032884040 | 0.02115068 |
Tempo | -0.22055323 | 0.004695732 | 0.16981515 | 0.13623320 | 0.03288404 | 1.000000000 | 0.06423906 |
Valence | 0.32204309 | -0.176266061 | 0.38158658 | 0.29612644 | 0.02115068 | 0.064239061 | 1.00000000 |
You will also be asked to make visualizations to explore the data and support your analyses. This will also be accomplished via a web application that lets you choose variables and plot types.
Summarize the dataset
- This dataset contains information about albums found on the Spotify streaming service.
- It contains 100 albums each from 14 different artists, so 1400 total observations.
- The dataset was created by a Cal Poly student for a research project.
- There are no major ethical concerns. Perhaps some bias in the specific artists that were chosen to be studied.
Research Questions
Answer each of the following research questions including all of these steps:
State the variables involved in the question, and give their types.
Make a visualization that addresses the research question.
State the parameter(s) that would answer the research question. Then, compute and report summary statistic(s) that estimate these parameters.
Calculate and interpret a z-score to address the question.
Report a hypothesis test, including stating the null and alternate hypotheses and using the Empirical Rule to estimate your p-value.
Summarize your results in real-world terms: what (if anything) do you conclude about Spotify songs based on this analysis?
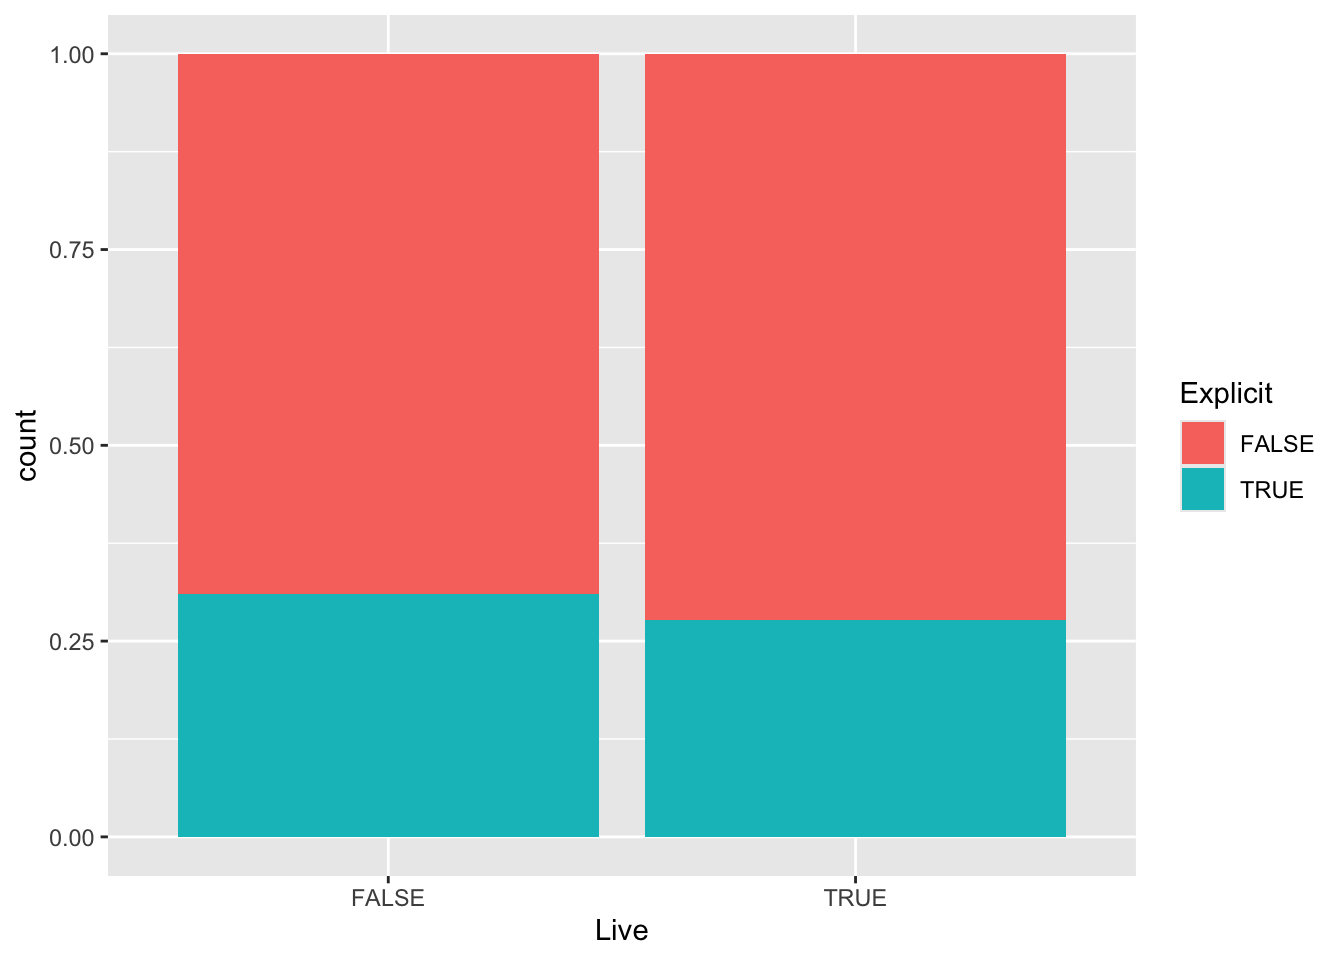
Are musical artists less likely to use explicit language when an album is played live?
1
Two categorical variables, Explicit and Live
2
3
Parameters: The true proportion of live albums that are explicit, and the true proportion of non-live albums that are explicit.
Statistics: \hat{p}_{live} = 0.28, \; \; \hat{p}_{non-live} = 0.31 #### 4
\hat{p}_{live} - \hat{p}_{non-live} = -0.03 S_{\hat{p}_{live}} = \frac{0.28*(1-0.28)}{155} = 0.036, \; \; S_{\hat{p}_{non-live}} = \frac{0.31*(1-0.31)}{1245} = 0.013
S_{\left(\hat{p}_{live} - \hat{p}_{non-live}\right)} = \sqrt{0.036^2 + 0.013^2} = 0.038 z = \frac{-0.03 - 0}{0.038} = -0.79
The observed difference in proportion of explicit albums between Live and Non-Live albums was -0.03, which is 0.79 standard deviations below zero.
5
H_0: \pi_{live} = \pi_{non-live} \;\; \text{ or "The true proportion of Live albums that are Explicit is equal to the true proportion of Non-Live albums that are Explicit."}
H_A: \pi_{live} < \pi_{non-live} \;\; \text{ or "The true proportion of Live albums that are Explicit is less than to the true proportion of Non-Live albums that are Explicit."}
p-value: About 0.2
There is a 20% chance of seeing a difference in proportions of 0.03, if the true proportions are equal.
We fail to reject the null.
6
We cannot conclude that artists are less likely to have explicit language on live albums than on non-live albums.
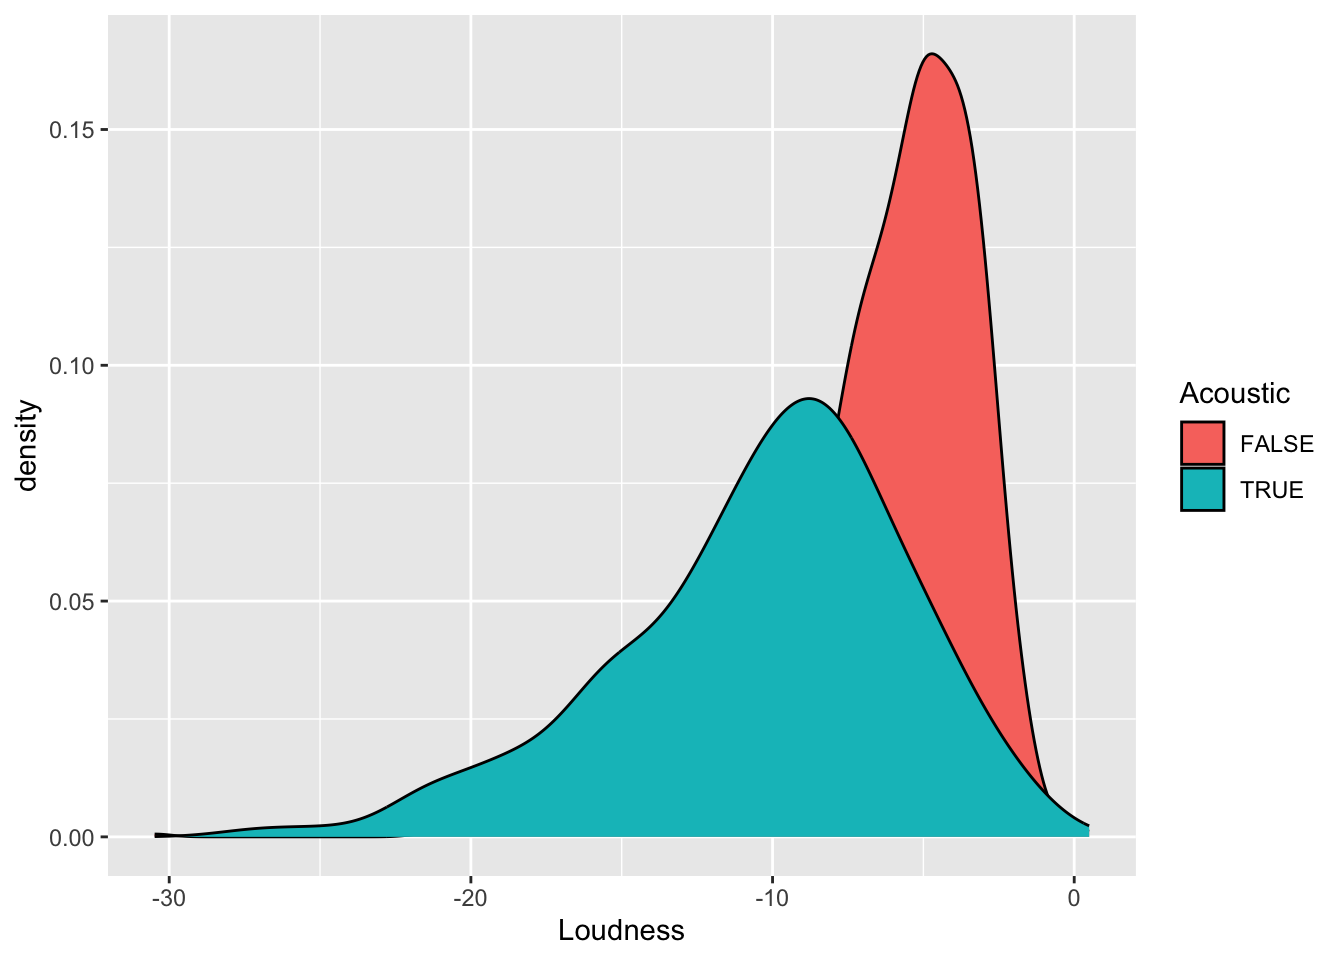
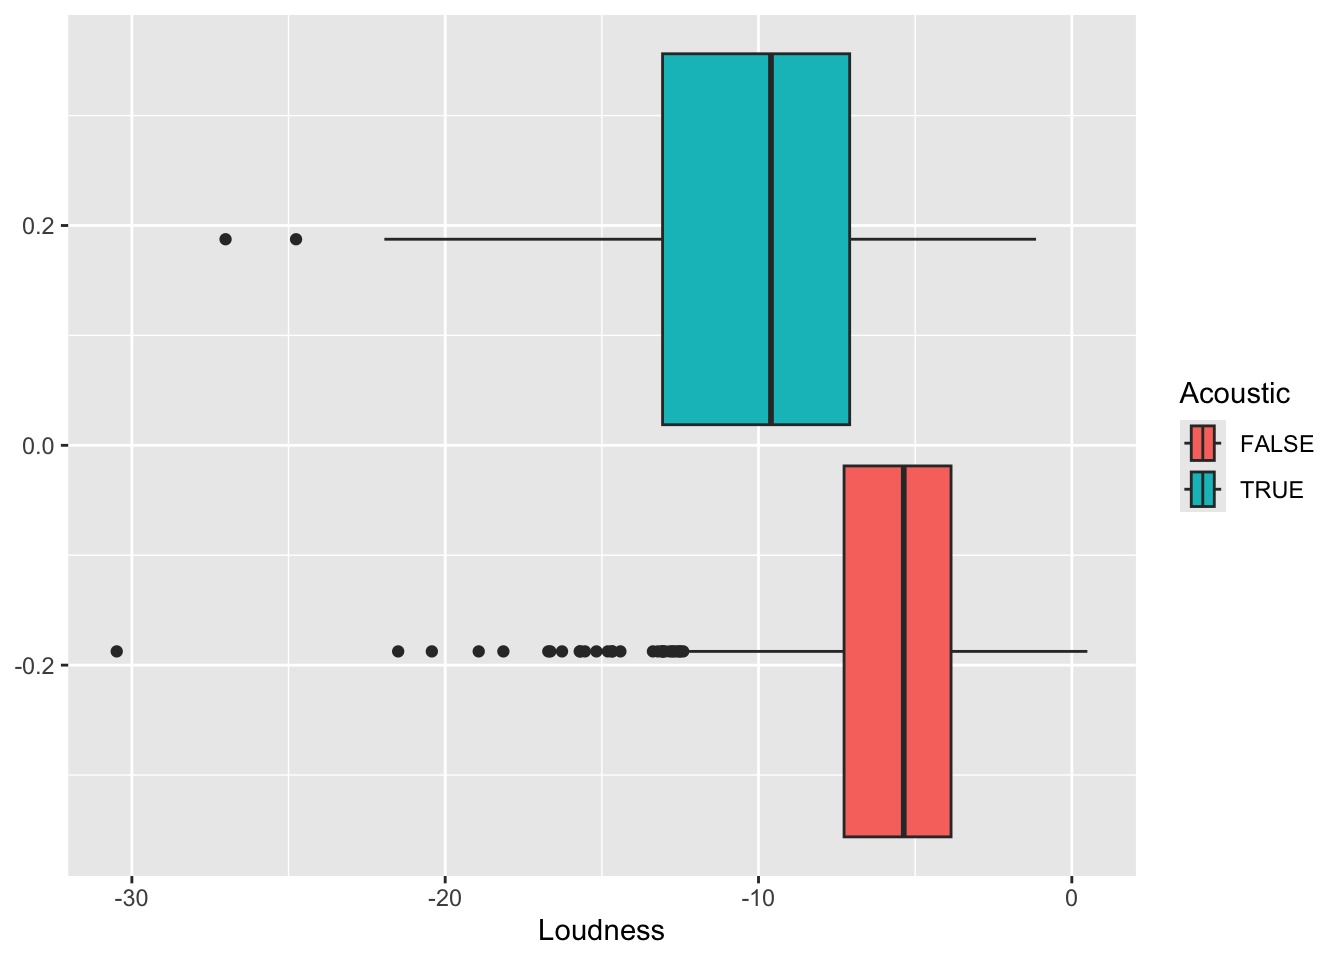
Are acoustic albums quieter than non-acoustic albums, on average?
1
Categorial variable (Acoustic) and quantitative variable (Loudness)
2
or
3
Parameters: the true mean loudness of acoustic and non-acoustic albums.
Statistics:
\bar{x}_{Acoustic} = -10.33, \;\; \bar{x}_{Non-Acoustic} = -5.84
4
\left(\bar{x}_{Acoustic} - \bar{x}_{Non-Acoustic}\right) = -10.33 - (-5.84) = -4.49
S_{\bar{x}_{Acoustic}} = \frac{4.77}{\sqrt{199}} = 0.34, \;\; S_{\bar{x}_{Non-Acoustic}} = \frac{2.79}{\sqrt{1201}} = 0.08
S_{\left(\bar{x}_{Acoustic} - \bar{x}_{Non-Acoustic}\right)} = \sqrt{0.34^2 + 0.08^2} = 0.35
z = \frac{(-4.49 - 0)}{0.35} = -12.8
The observed difference of mean loudness between acoustic and non-acoustic was -4.49. This is 12.8 standard deviations below zero.
5
H_0: \mu_{Acoustic} = \mu_{Non-Acoustic} \;\; \text{ or "The true mean loudness of Acoustic albums is equal to the true mean loudness of Non-Acoustic albums."}
H_A: \mu_{Acoustic} < \mu_{Non-Acoustic} \;\; \text{ or "The true mean loudness of Acoustic albums is less than to the true mean loudness of Non-Acoustic albums."}
p-value: 0
There is a nearly 0% chance of seeing a difference of means below -4.49, if the true mean difference is 0.
6
We found strong evidence that acoustic albums are quieter than non-acoustic albums.
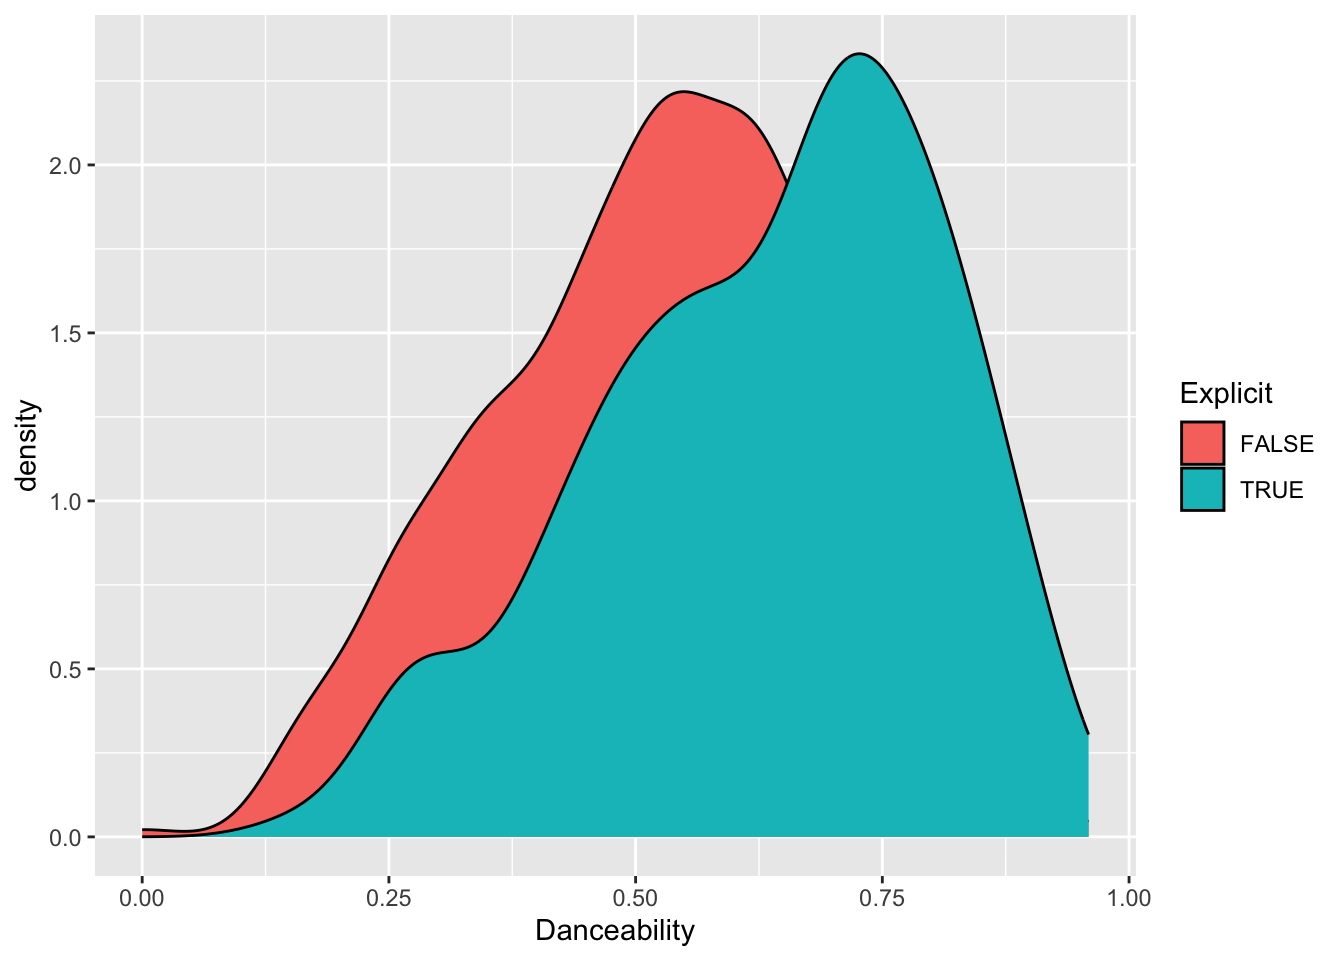
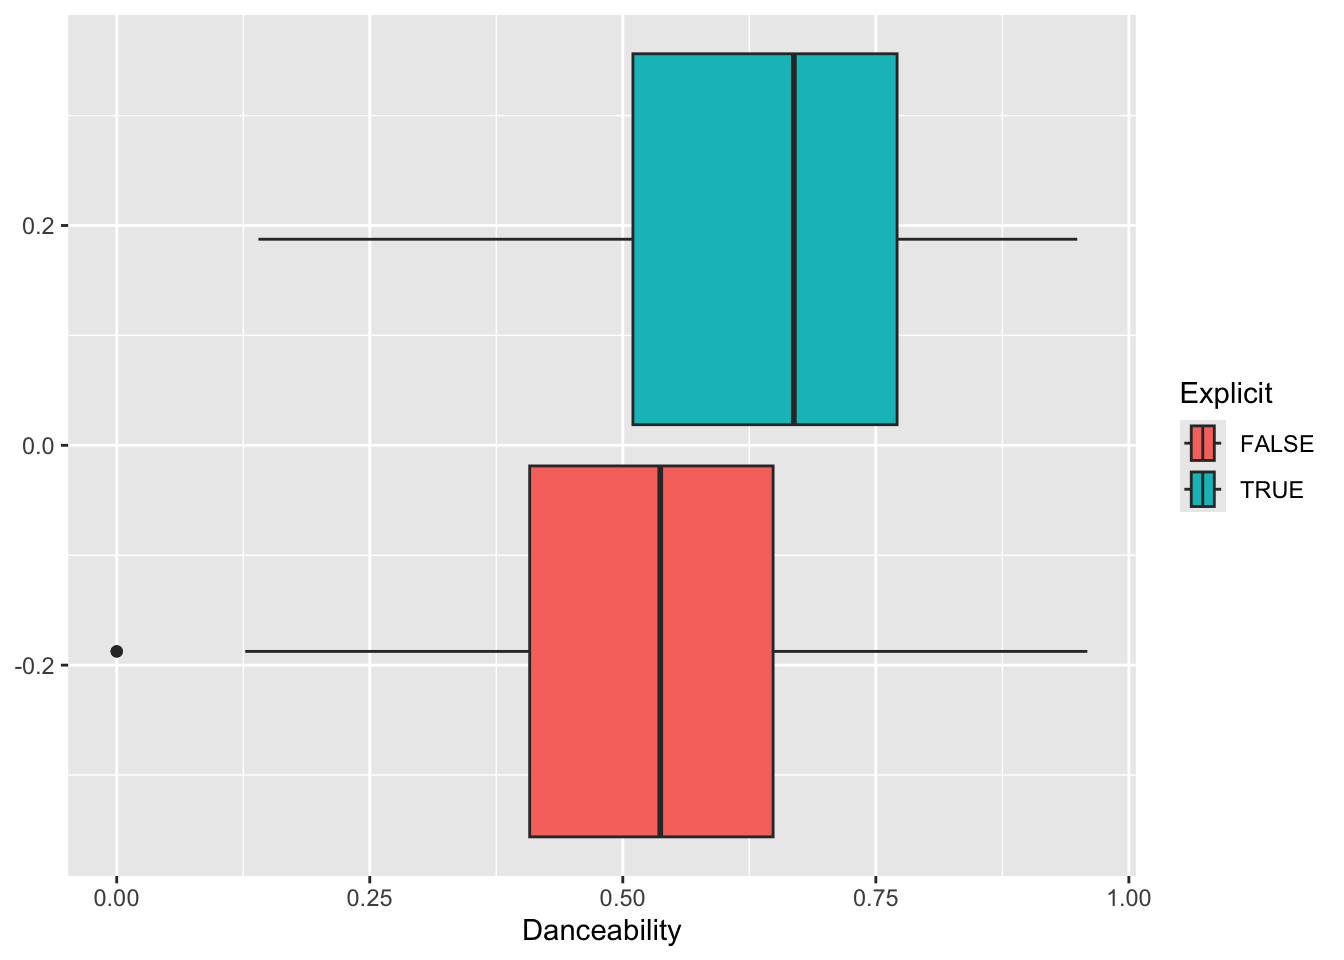
Do explicit albums tend to be more danceable?
1
Categorial variable (Explicit) and quantitative variable (Danceability)
2
or
3
Parameters: the true mean danceability of explicit and non-explicit albums.
Statistics:
\bar{x}_{Explicit} = 0.63, \;\; \bar{x}_{Non-Explicit} = 0.53
4
\left(\bar{x}_{Explicit} - \bar{x}_{Non-Explicit}\right) = 0.63 - 0.53 = 0.1
S_{\bar{x}_{Explicit}} = \frac{0.17}{\sqrt{429}} = 0.008, \;\; S_{\bar{x}_{Non-Explicit}} = \frac{0.17}{\sqrt{971}} = 0.005
S_{\left(\bar{x}_{Explicit} - \bar{x}_{Non-Explicit}\right)} = \sqrt{0.008^2 + 0.005^2} = 0.009
z = \frac{(0.1 - 0)}{0.009} = 11.11
The observed difference of mean danceability between explicit and non-explicit albums was 0.1. This is 11.11 standard deviations above zero.
5
H_0: \mu_{Explicit} = \mu_{Non-Explicit} \;\; \text{ or "The true mean danceability of Explicit albums is equal to the true mean danceability of Non-Explicit albums."} H_A: \mu_{Explicit} > \mu_{Non-Explicit} \;\; \text{ or "The true mean danceability of Explicit albums is higher than the true mean danceability of Non-Explicit albums."} p-value: 0
There is a nearly 0% chance of seeing a difference of means above 0.1, if the true mean difference is 0.
6
We found strong evidence that explicit albums are more danceable than non-explicit albums.
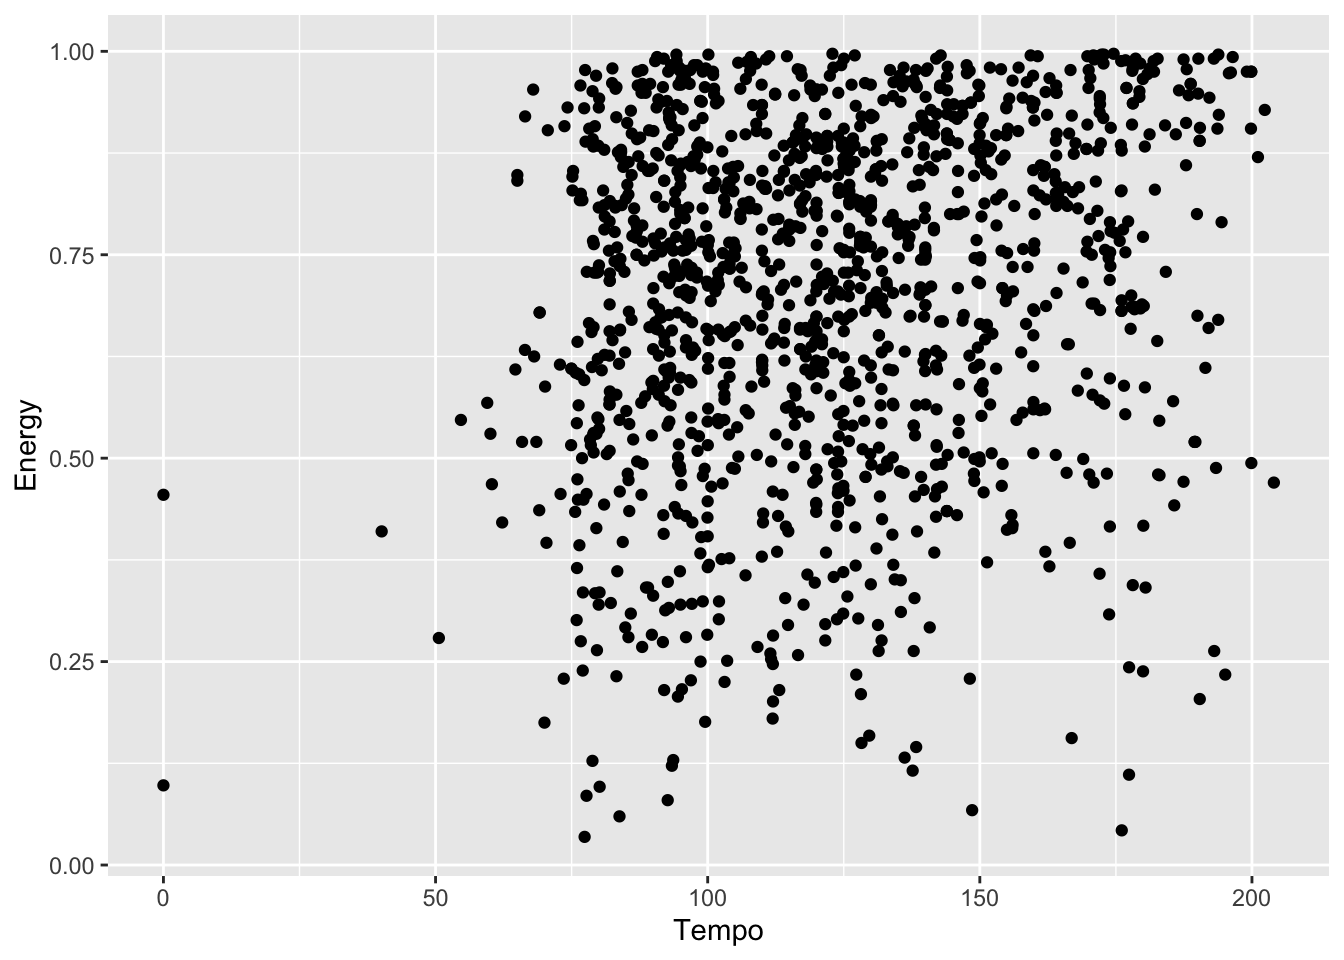
Do high energy albums have a faster tempo?
1
Two quantitative variables: Energy and Tempo.
2
Parameter: The true correlation between energy and tempo of albums.
Statistic: r = 0.17
3
(Okay if x and y are switched.)
4
S_r = \frac{1 - 0.17^2}{\sqrt{1400}} = 0.026
z = \frac{0.17 - 0}{0.026} = 6.5
The sample correlation of 0.17 is 6.5 standard deviations above 0.
5
H_0: \rho = 0, \;\; \text{ or "The true correlation is zero."}
H_A: \rho > 0, \;\; \text{ or "The true correlation is positive."}
p-value: 0
There is a nearly 0% chance of seeing a sample correlation of 0.17 or above, if the true correlation is 0.
6
We found very strong evidence that there is a positive association between energy and tempo.
Tell a story
Choose two artists in this dataset who you would like to compare to each other.
Come up with three research questions:
A question comparing a categorical variable across the two artists.
A question comparing a quantitative variable across the two artists.
A question comparing the correlation between two quantitative variables across artists. (That is, we want to ask “Is the correlation between Variable X and Variable Y different for Artist A than for Artist B?”)
Answer one of the research questions you wrote by performing a full hypothesis test.