SalePrice | YrSold | Size(sqf) | Floor | TimeToSubway | SubwayStation |
|---|---|---|---|---|---|
159292 | 2012 | 914 | 8 | 10min~15min | Kyungbuk_uni_hospital |
60176 | 2011 | 587 | 7 | 5min~10min | Daegu |
79646 | 2009 | 644 | 9 | 15min~20min | Myung-duk |
185840 | 2014 | 914 | 22 | 15min~20min | Myung-duk |
194690 | 2013 | 903 | 7 | 0-5min | Myung-duk |
10 2.3 Exercises
The following exercises ask questions about a dataset of 291 apartments sold in Daegu, South Korea in recent years.
A few rows of the dataset are shown here:
10.1 Exercises 2.3.1
The following is a map of the Daegu subway system:
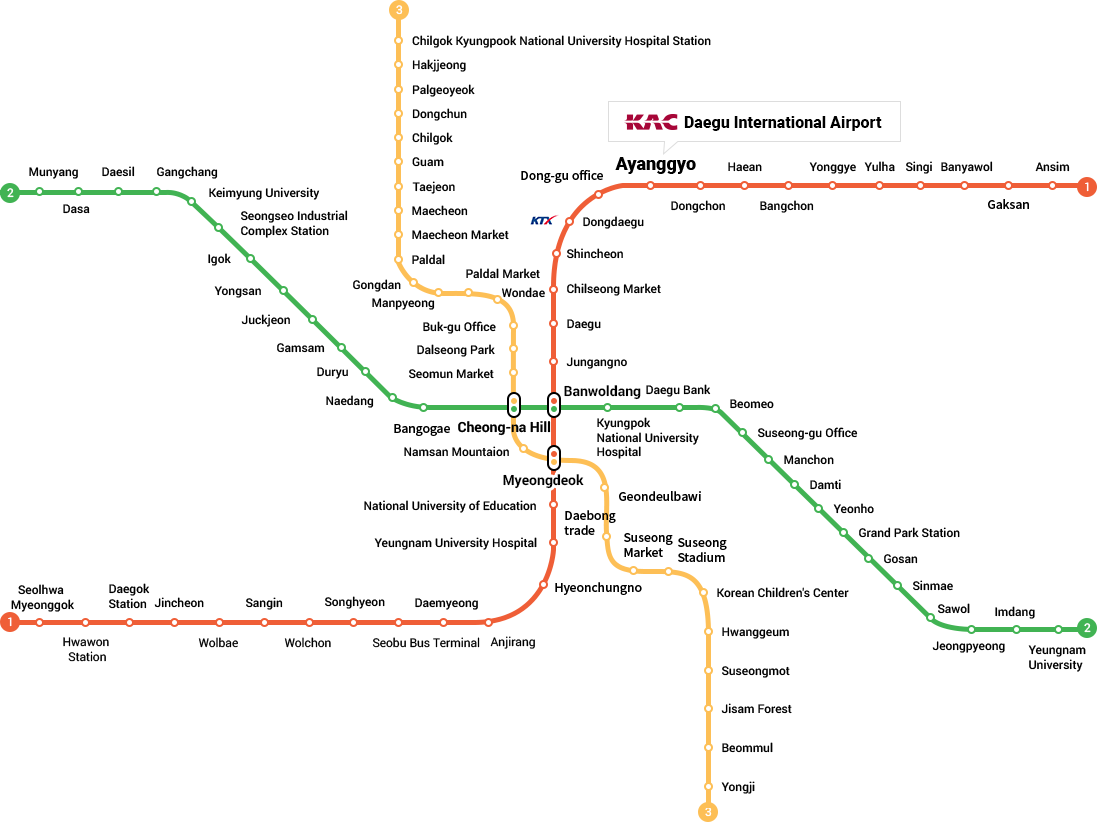
There are three major downtown stations: Cheong-Na Hill (does not appear in this dataset), Banwoldang, and Myeongdeok (Myong-duk).
We first like to know whether the regions near the two major stations are similarly priced. The table below gives some summary statistics:
SubwayStation | mean_price | sd_price | count |
|---|---|---|---|
Bangoge | 169583.6 | 65069.48 | 36 |
Banwoldang | 312262.1 | 100677.98 | 37 |
Chil-sung-market | 114690.0 | 54548.18 | 5 |
Daegu | 132189.5 | 105165.58 | 4 |
Kyungbuk_uni_hospital | 256527.8 | 102699.74 | 82 |
Myung-duk | 158532.9 | 83788.47 | 75 |
Sin-nam | 260563.6 | 92617.54 | 32 |
no_subway_nearby | 228331.4 | 101290.71 | 20 |
Do Myung-duk and Banwoldang regions have similarly priced apartments?
Compute the relevant summary statistic to answer the question.
Compute the standard deviation of the summary statistic.
Report and interpret a standardized score.
10.2 Exercises 2.3.2
Perhaps apartments are more expensive in the Banwoldang area because they tend to be closer to the subway station.
The following table gives summary statistics for the variable SubwayStation, which tells the nearest station to the apartment; and the variable TimeToSubway, which tells long it takes to ride the bus to the nearest subway station.
SubwayStation | 0-5min | 10min~15min | 15min~20min | 5min~10min | no_bus_stop_nearby |
|---|---|---|---|---|---|
Bangoge | 0 | 0 | 0 | 36 | 0 |
Banwoldang | 33 | 0 | 0 | 4 | 0 |
Chil-sung-market | 0 | 0 | 5 | 0 | 0 |
Daegu | 0 | 0 | 0 | 4 | 0 |
Kyungbuk_uni_hospital | 56 | 26 | 0 | 0 | 0 |
Myung-duk | 17 | 13 | 45 | 0 | 0 |
no_subway_nearby | 0 | 0 | 0 | 7 | 13 |
Sin-nam | 29 | 0 | 0 | 3 | 0 |
We are interested in answering the research question: Is an apartment near Banwoldang more likely to be a <5 minute commute than an apartment near Myung-duk?
Compute the relevant summary statistic to answer the question.
Compute the standard deviation of the summary statistic.
Report and interpret a standardized score.
10.3 Exercises 2.3.3
Perhaps region (or proximity to subway station) is not the only thing that impacts the price of the apartments.
The following table shows the correlations between the quantitative variables in this dataset:
Variable | SalePrice | Size.sqf. | Floor |
|---|---|---|---|
SalePrice | 1.0000000 | 0.7402109 | 0.3658820 |
Size(sqf) | 0.7402109 | 1.0000000 | 0.1986749 |
Floor | 0.3658820 | 0.1986749 | 1.0000000 |
Notice that the correlations between every variable and itself is 1. Why is this?
Is there evidence of a relationship between price of an apartment and size?
Is there evidence of a relationship between price of an apartment and which floor it is on?
Suppose we converted the
TimeToSubwayvariable into a quantitative variable, representing each range by it’s midpoint. (For example, the category5min-10minwould become the number5.5.) Do you think the correlation between this variable and the Sale Price would be positive, negative, or approximately zero? Why?